|
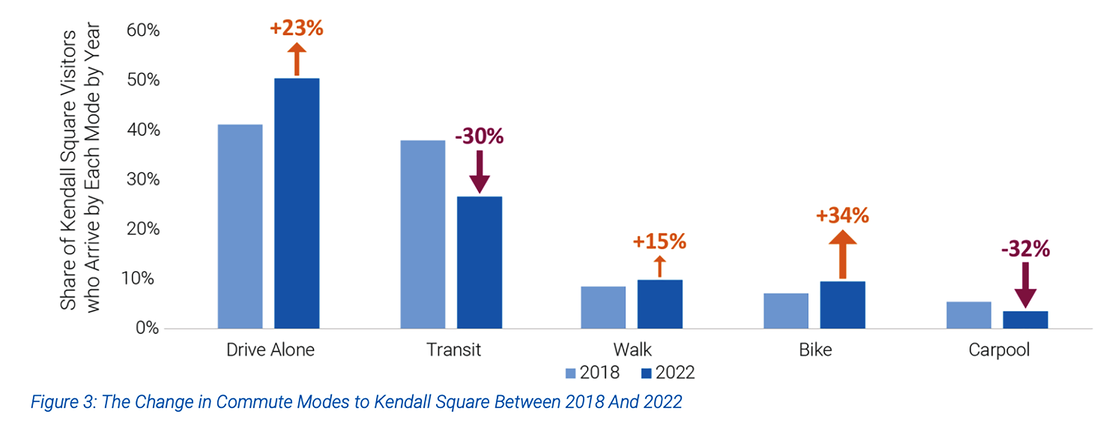
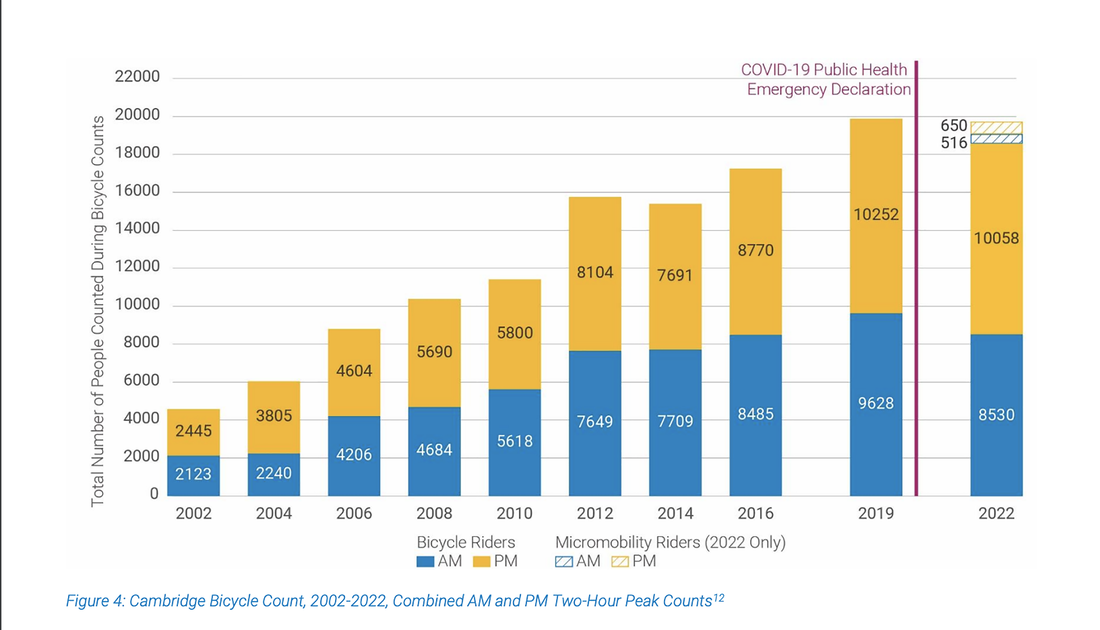
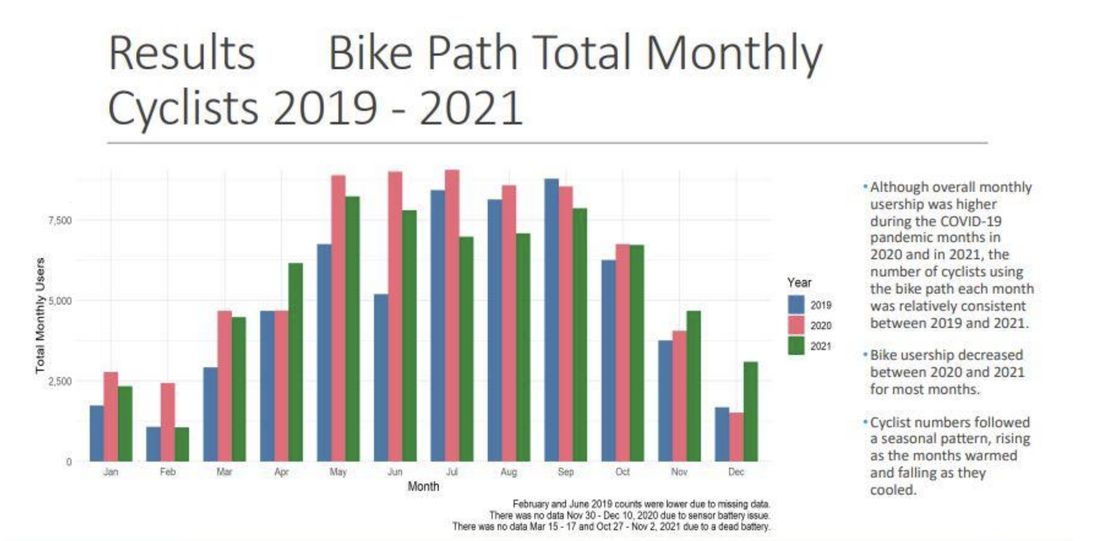
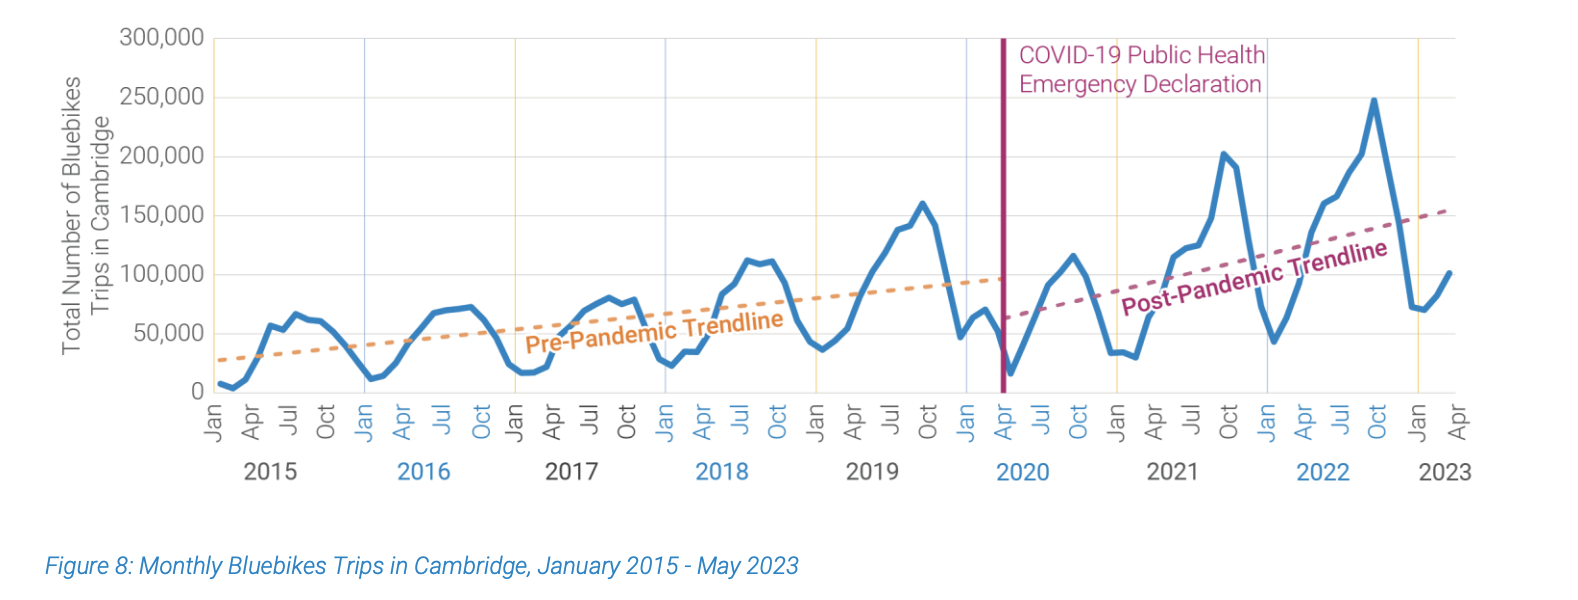
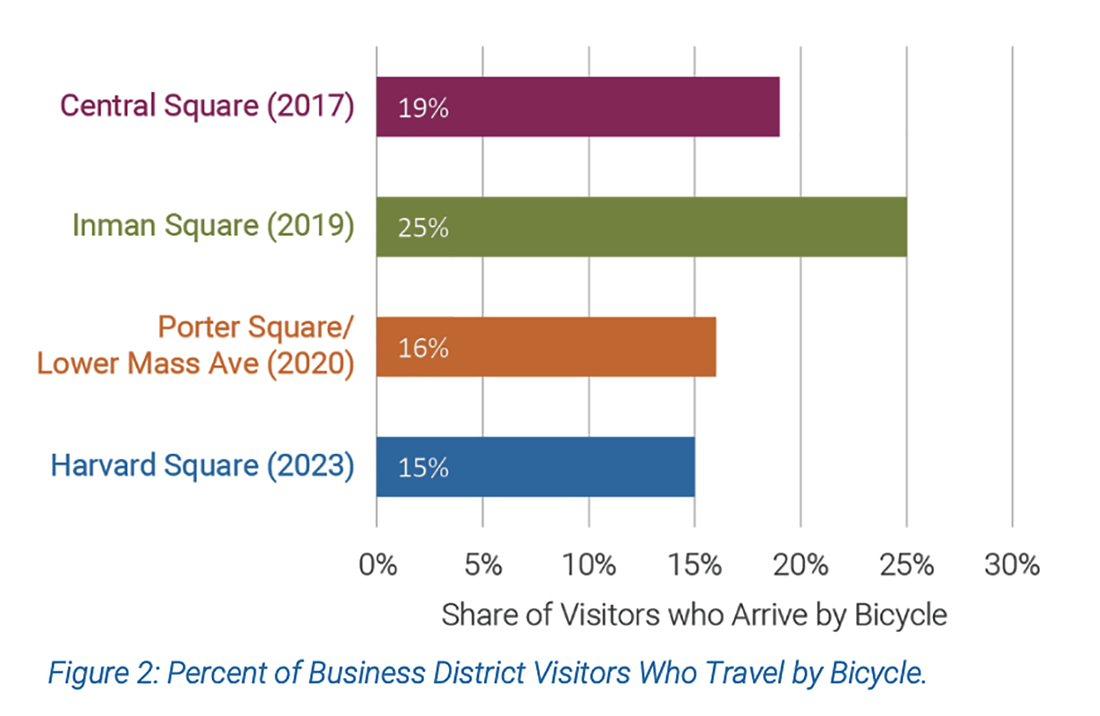
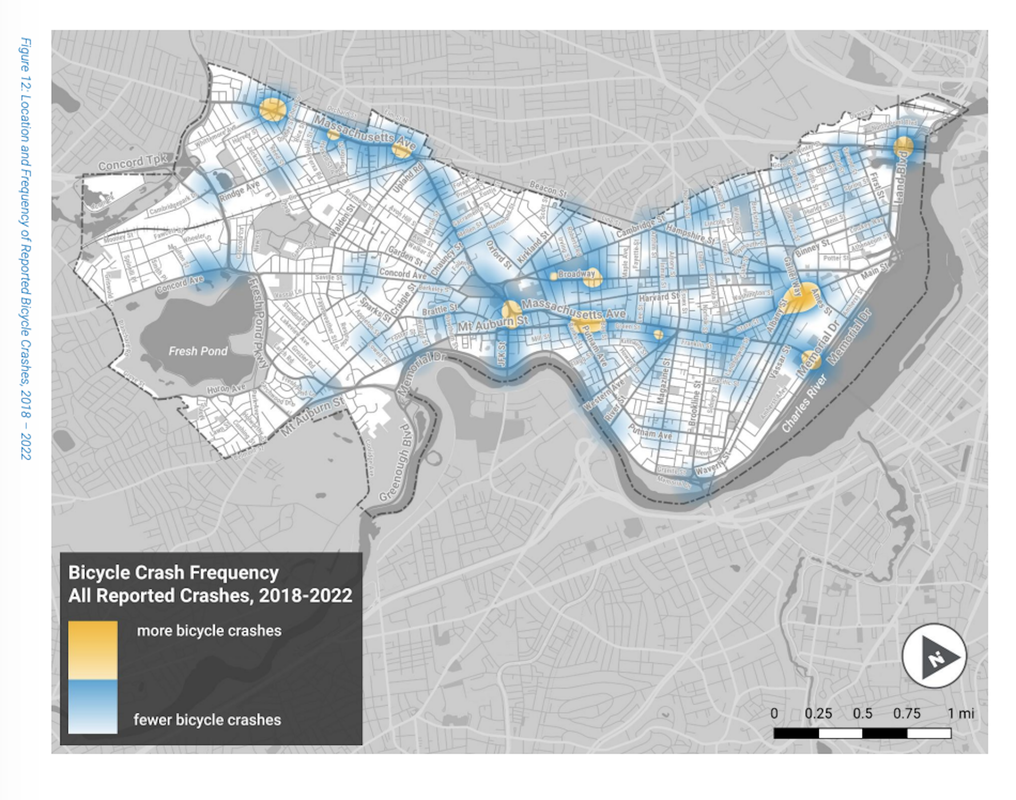
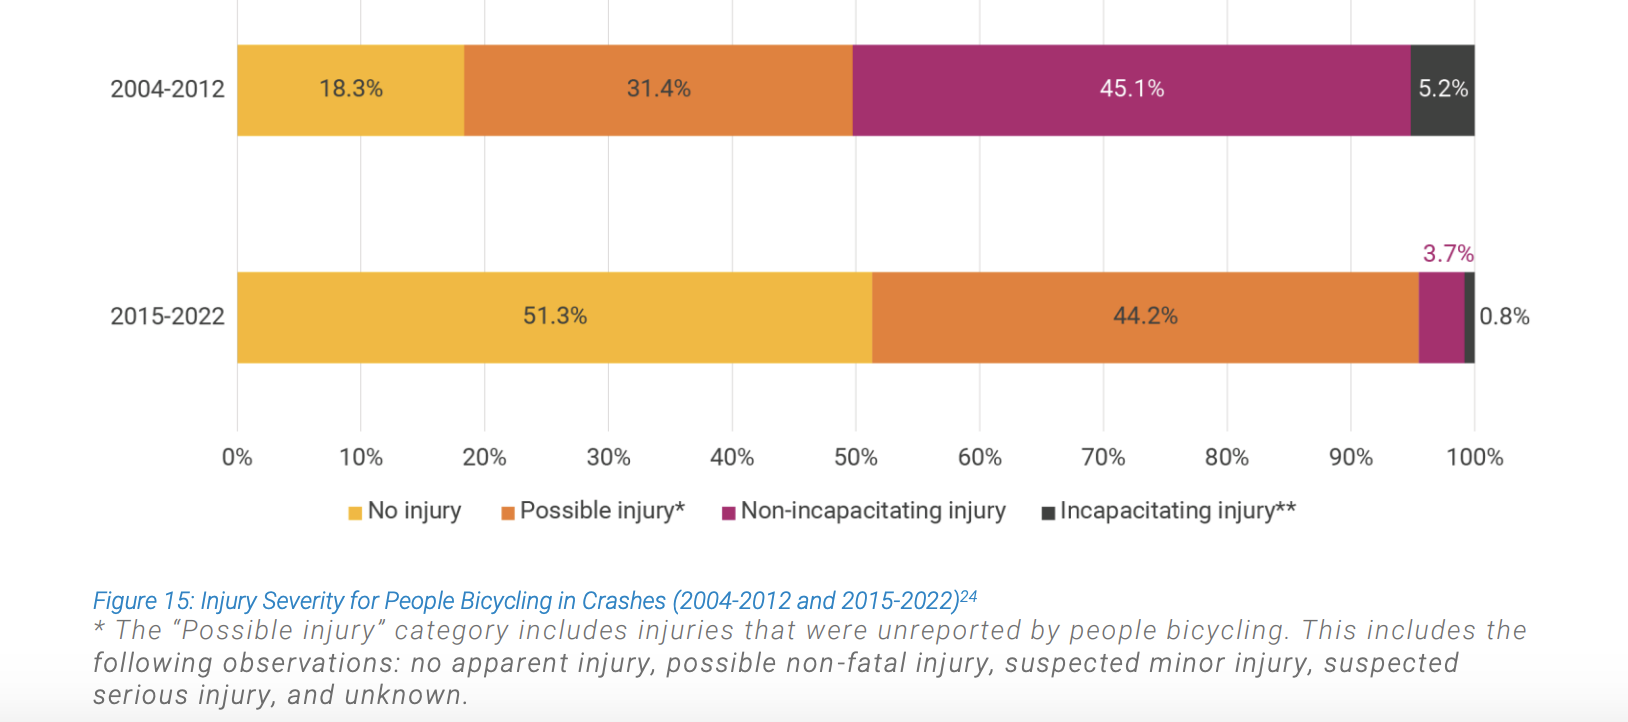
The 2023 Cambridge Bicycling Data Report is out. You can also read it HERE. The array of graphs shown here are from this report. You can also view the citywide data itself HERE The good news is that the number of children riding bikes is increasing. But there are a number of other problems highlighted in this report One concern is that the city has not done the kind of data collection, analysis and reporting that is helpful to understanding how our bicycle policy is working and not working. The City's current approach to collecting bicycle activity is insufficient to provide a precise number. Indeed the City currently has only one location that counts cyclist activity 24 hours a day, 7 days a week and 365 days a year and that site is in Kendall Square (with a largely younger population). By comparison, Portland Oregon has over 70 sites that measures activity 24/7/365. Those who seek to show the positive side of this report often offer as key takeaways the view that. 1. People in Cambridge are biking more (23% increase in recent years). 2. Car ownership per household in Cambridge has steadily declined since 2000. 3. Bicycle crash rates and the number of serious injuries continue to decline and a reduction in bike riding on sidewalks. The report also does not address an array of other information that the 2023 Bicycling Data Report reveals including considerable unfortunate news for the city. Most importantly the data shows that: 1) the number of people driving alone in cars has increased 23% since 2018 (counter to the aims of our Envision Report goals; 2) transit use is down 30% in the same years; 3) carpooling is also down 32%. While there is an increase in bike ridership the rates remain stunningly low (at about 9%, up from c.7%). Stated another way, the "23% increase" in Cambridge resident bike riding commuters corresponds to an increase of just 1.6% of all Cambridge resident commuters (9% is a 23% increase from 7.4%) over the course of a DECADE (from 2007-2011 to 2017-2021). So too, cycling counts (and thus BMTs) have DECREASED by ~5% from 2019 to 2022 (~22k vs ~21k) despite an approximate doubling of the number of miles of separated bike lanes (~5.5 mi in 2019 to ~11.5 mi in 2022. The increased single driver car traffic coupled with fewer transit users and fewer traffic lanes, means that not only are people spending more time driving to where they need to go, but also a key part of that time is likely in increasingly clogged up streets adding to environmental harm. In addition as we will see, there remain MAJOR gaps in bicycle use in the winter months, during which time many fair weather cyclists are likely using their cars. Another problem with the report relates to the bicycling safety numbers which are reported to have improved with separated bike lanes. However, unlike other categories of the report, the City appears not to have calculated for the COVID 19 period when far fewer cars were on the roads in Cambridge. And the City has not provided any concrete data showing the numbers of bicyclists riding on sidewalks in earlier years (much less with a year by year count). Moreover, nothing in the report addresses the demographic inequities that are in play here. As Anthony Gallucio notes on Nextdoor (Oct. 29, 2023) "It would be great to get demographic data on income and those that bike and drive. I know many lower income folks who do not have the privilege of working with in 5 miles of home and have sole child caring responsibility. They are all over the place and cannot afford parking. We talk about equity but only when it’s convenient.... It is a pretty perfect world when you can afford to live close enough to walk or bike to work.... If you live in public housing on Main Street you may not work in Kendall. You might have a ways to go and have to cart your kids around. Eliminating travel lanes doubles traffic back up (simple math). Eliminating parking has real burdens for car dependent residents....Its not a secret what the demographic is and where and when the demand is. The persons left out of this conversation are just trying to live... Lets just be honest about the drastic demographic differences involved here and ancillary needs and challenges." When we look at the data on bicycle riders and micro-mobile forms (scooters etc - probably younger riders and students) we see something equally noteworthy. Compare bicycle usage in 2016 and 2022 (8485 versus 8530) and you will see a whopping increase of 45 bicycle riders in that time period, despite all the city publicity about bicycle riding, bicycle lanes, and the city's push for people to replace their cars with bicycles. What the bicycling reporters generally also leave out is the vast differential in bicycle use between warmer summer months and cold and icy winter months. December, January and February when bicycle usage falls way off in Cambridge. In the winter months, those few cyclists who usually ride bikes to work, the doctor's and the grocery store, instead must find another transportation mean - most likely cars since public transportation use is now way down. During the winter months, the streets are critical for Cambridge residents and workers getting to work and other activities by car during the long winters months. During these winter months, car parking is also critical. Much the same lower bicycle ridership in the winter months can also be seen in another included graph. What is clear in Cambridge is that we still need vehicle lanes in the cold winter months, even if, averaged out (including many students and tourists) the number of riders is slightly up. And based on the separate blue bike data significant part of the increased bicycle use during the summer months is due to increased area tourism. The city has spent an enormous amount of money on building out our bicycle infrastructure. As the below map shows, most of the city has nearby bicycle lanes now, with peak bicycle counts coming from several hubs - Kendall Square, Inman Square and North Cambridge (the latter near the Arlington/Somerville line). The question is how many more separated bicycle lanes we should add, and how many more critical car parking spaces the city should remove. Another issue that remains is where ride shares (uber/lyft) fit into this data. With the streets increasingly clogged and street parking harder and harder to find, those wealthy enough to use ride shares may likely are increasing this usage especially if there are time constraints or one needs to go where public transportation of simply walking is not a possibility. The data report does not appear to be addressing the wide share issue effectively. 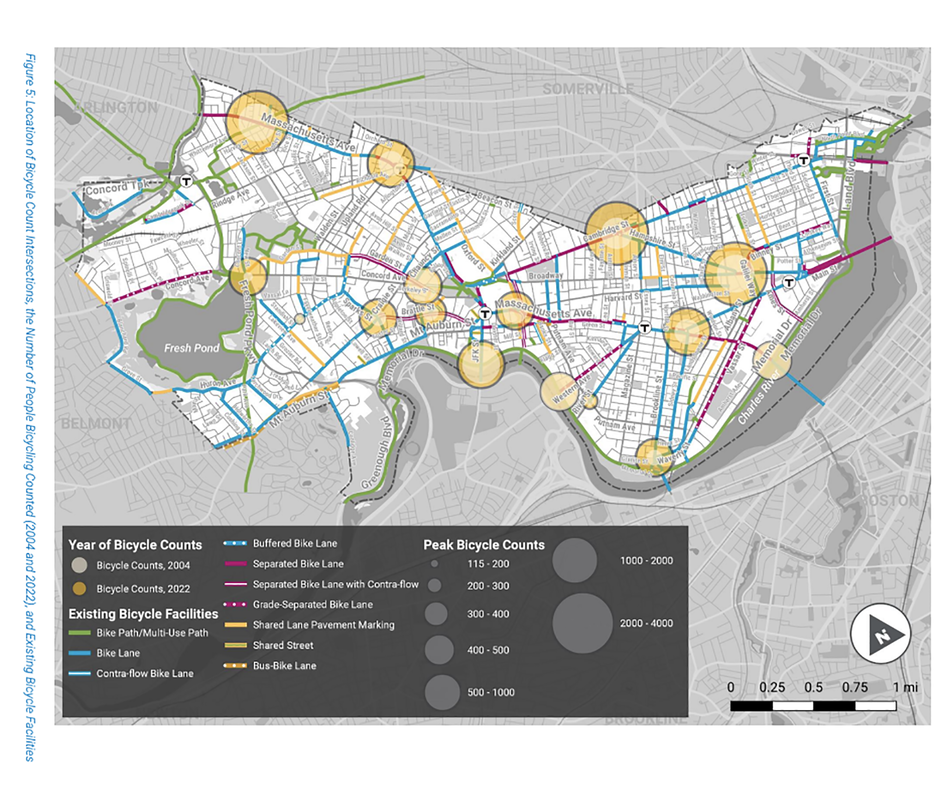 The business visitor data on bicycling use is also revealing. The percent of those who visit these businesses by bike remains small, probably even smaller when we analyze this data on a month by month basis. Inman Square the only one of these without a subway station does best. But no business can do well if one if clients who must arrive by car are decreased significantly. 75% to 85% of one's former business is not enough to keep the door open. What also would be important to know is which types of businesses tend to do better than others in this situation. My guess is that it would be restaurants and bars which tend to be open when other businesses (and needed car traffic) are closed. While there is positive news about bicycle crashes (and the severity of these) what also is clear is that there remain key areas of risk, especially in the most widely used areas of the city - North Cambridge, Kendall Square, Central Square and Harvard Square. And while the number of bicycles riding on sidewalks is said to have decreased, we are provided with no data on prior crashes involving bicyclists and pedestrians on sidewalks (or streets). Nor are we seeing data on the impacts on e-bikes and or e-scooters. While it is good news that the bicycle injury rate appears to be significantly down, particularly for incapacitating injuries, the graphs make no accounting of the fact that during COVID vehicular use was also down. To really see what the before and after differences are we would need the COVID year indicator included in the graph much as was done for bicycle use and monthly bicycle use in the other graphs. One also wonders why e-bikes and regular bikes are not separated out in the data since in other cities (like NYC) this has been an important safety factor. And, based on the dates selected, it is not clear how much of the safety changes are due to the separated bike lanes as opposed to other factors including greater awareness of the importance of bicycling and vehicular safety by the city and by the bicycling advocacy group which is very active on social media and neighborhood list serves. It is noteworthy too that much of this data is based on self-reporting by bicyclists (who have been actively making this data publicly available), yet we have no comparable data on "no injury" or "possible injury" or "non-incapacitating injury" by pedestrian groups or individuals or even self-reporting by individual drivers or groups of drivers. It is great to see a 4.4% drop in incapacitating injuries between the selected years but here too further questions come up. Why these years; why compare an 8 year period (from 2004-2012) with a 7 year period (from 2015-2022), and since there are so few such situations of serious harm (a plus), it would be important to address them on a case by case basis regarding time of day, time of year, location, helmet use, and other factors. In the end, the 2023 Cambridge bicycle data report while important, also reveals an array of disappointments. What we see here, run counter to our Envision Goals of decreasing vehicle use. Instead we find that car use is up and public transit use is down. While we can't blame all the public transit woes on the city, it is not clear if the city did enough to keep critical transit routes in play in the recent metro shift in plans. Moreover what we also likely are seeing in this report is that some of the residents and workers most impacted here are lower and middle income individuals who need their cars to make a living. There are similar issues in play for many seniors and disabled residents. In the end we not only need far more city bicycling data (and a better presentation of the findings) but also a more holistic approach to transit in the city.
Yes, more children are riding bikes (a positive) but many of their parents appear to be still driving regularly for various reasons and need our streets to get where they are going and securing parking. Moreover, some 40% of Cambridge residents work from home (likely among our wealthier residents) and we have no evidence that they are letting go of their cars and bicycling where they need to go. So while this report is welcome, hopefully the next one will come with a far more complete set of data (24/7/365 throughout the city) and better reporting of it. And, in the mean time, since reducing vehicle traffic in the City is a key goal of the Envision report it is clear that adding a large infrastructure of bicycle lanes to date has not so far factored positively in this.
0 Comments
Your comment will be posted after it is approved.
Leave a Reply. |
