 CCC PRIORITIES 2024-25 CCC looks forward to working with every Councillor, city staff member, resident, and business across the city to help our city government achieve the following policy or process changes. This can be a year of real progress for the city. 6 Top Priorities Better Government: Speed responses to public records requests; require clerk (or others) to publish votes with initials on city website during Council and other public meetings; publish weekly meeting calendar; add more separation between Councillors and judiciary committees (BZA, Cambridge Historical Commission, Planning Board); limit House Doctor (our “in house” pre-approved contractor projects) to below $500K. City Finances: 5-year plan to keep city fiscally sound; more upfront detail on development proposal costs; maintain low residential and commercial property taxes. Environmental Issues and Climate Resiliency: Annual City updates on climate change results; published plan for new infrastructure; enact Urban Forestry Master Plan; improve environmental impact studies re climate goals. Housing: Support the rights of tenants against unfair evictions, lease terminations, and rate hikes; encourage adoption of Senate bill S684 providing legal counsel; add financial incentives for property owners to add units to existing homes and keep rents below market rates for non-family for a fixed time period; allow multifamily zoning citywide without unduly increasing property values and impacting green space; create citywide design review committee; promote city purchased land for housing (land trusts) and lease land to developers; add regular independent reviews of tenant concerns and building upkeep; provide a single anonymized list of housing applicants and update annually. Neighborhoods: Provide more local meeting places and encourage more neighborhood groups citywide; host annual city council meeting with neighborhood group leaders; address long term vacancies (homes and local businesses) by adding escalating fee structure. Do annual review of ISD requests and completions. Simplify and speed up responses to street light outages etc. Transportation and Infrastructure: Traffic camera use for better counts citywide and consider violation tickets like DC; address best practices for safest bicycle, scooter, skateboard use; Modified broadband for city square open spaces and both low income and senior housing. CCC 6 Top priorities (Detailed) Better Government
major purchases. Use the City-wide mailings to highlight policy changes, including zoning and financial issues.
City Finances
Environmental Issues and Climate Resiliency
Housing
Neighborhoods
Transportation and Infrastructure
0 Comments
Cambridge City Charter - Change Proposals: Major New Governance and Voting Changes in Play11/22/2023  The City's Charter Review Committee presented an outline of its proposed. Support for a Strong Mayor system of late has a 9 to 5 majority. Unlike Boston and other progressive cities which have a partial ward-based Council election system, ours would continue to be citywide. The current proportional representation system would be retained. Lowering the voting age to 16 is proposed as is allowing non-citizens to vote in local elections. One of the more unusual proposals is the creation of a Citizen's review committee, which would have the power to bring items to Council and require a vote. This piece of the proposal has come by way of Poland, and members would be selected based on city demographics, further shifting power to younger city residents (including students at our three plus universities or post-docs here for a very short period of time). A number of members of the committee have been missing from various of the meetings so the actual support for some of the items remains unclear. Also relatively few residents have attended these meetings or supplementary ones set up to inform the public what is happening. Charter Review Website: https://www.cambridgema.gov/charterreview Contact the Charter Committee here: CharterReviewCommittee@cambridgema.gov Timeline: December 5 Meeting December 19 Meeting Zoom Link to attend these meetings: CharterReviewCommittee@cambridgema.gov December 31, 2023: The committee plans to submit its report. This report then will be taken up by the next Council. Following their vote, this will go to the state house, and come back to Cambridge for a vote. 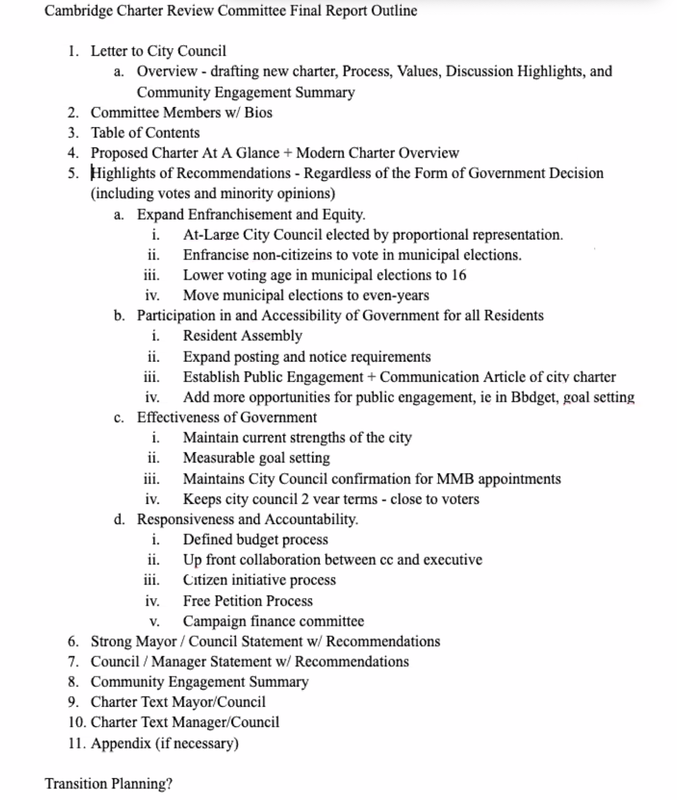 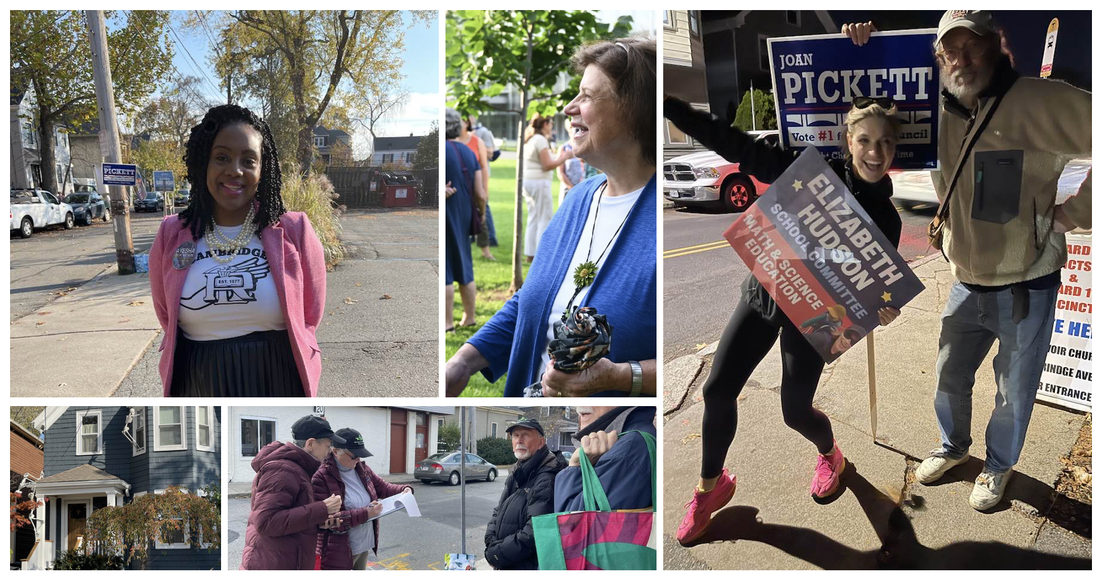 , This was a really important election. The Harvard Crimson has done a good overview of it! HERE In this election as in previous ones, the transfer votes are key! Looking at the round-by-round vote shift, it looks like there were much clearer patterns of votes transferring between candidates of the same slate than in years past. City-wide "slates" (sets of endorsements) were very important this year as in previous ones. Significantly in 2023 Sumbul Sumbul (the current Mayor) received only 3,000 votes (circa 1,000 she could transfer down); last election (in 2021) she received 4,000 votes (2,000 of which were transferred down). This year, like last year, her extra votes were key to getting other members of her "slate" elected - most notably Marc McGovern. Here is a list of those elected. CCC candidates indicated in purple; incumbents are indicated with an (I) CITY COUNCIL (in order of election):
SCHOOL COMMITTEE (in order of election):
What this points to more directly is the enduring power of incumbency in Cambridge elections through ranked choice voting in both the school committee and city council elections. And when two out of three of the "open seats" are filled by CCC candidates that is something to be truly celebrated! Transfer votes clearly mattered this year as they did in past elections. SEE CHARTS BELOW. Both Ayesha Wilson and Joan Pickett were elected in the 17th round. Cathie Zusy lost in the 15th round; Jivan Sobrinho-Wheeler was elected to council in the 15th round as well. CCC slate voters did a particularly good job in getting our candidates elected. Indeed this year was one for the records.: Councillors elected with more transfer votes than #1 votes: 6 in 1941 (83 candidates!) Cassidy 1943, 59% (39) Pickett 2023, 58% (24) Foley 1951, 55% (27) Pill 1943, 55% Pill 1955, 54% (42) Vellucci 1955, 52% DeGuglielmo 1945, 52% (37) Cheung 2009, 50.7% (21) McNamara 1957, 50.1% (40) Transfer votes in the 2023 election for City Council 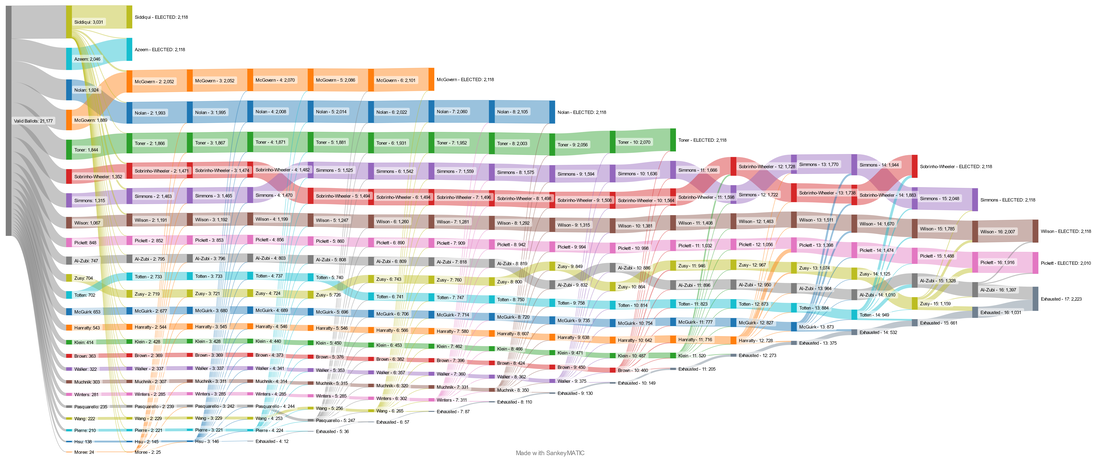 A good long-time voting strategy is to decide who one would really like to see on the council (or school committee) and then vote for them in order, weaker to stronger. This year some changed that to vote for the weaker CCC candidates before the incumbents they wanted to see stay, to keep the vote focused on supporting those who would really need it. Slate voting really made a difference this year, but more important is how hard the candidates worked. 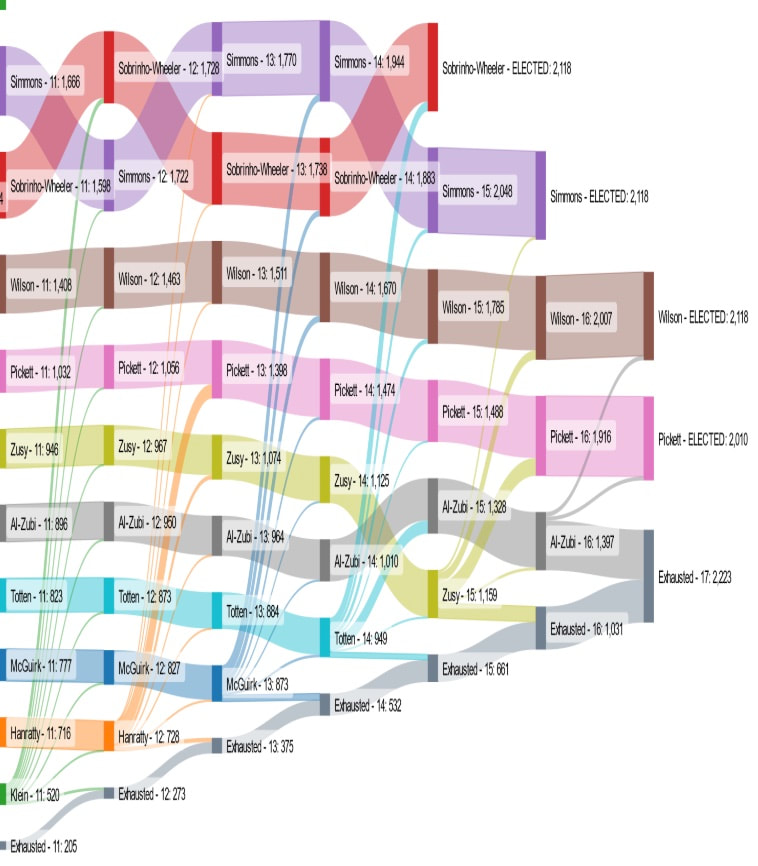 Above is a enlargement of the last 5 transfers which determined who was going to be the 9th member elected. One can see how votes transferred over to Pickett when it was needed. At that point Sobrinho-Wheeler, Simmons, and Wilson are considerably ahead, but the last 5 are bunched in a narrower range, and only 1 could be elected. Hanratty gives a strong transfer to Pickett. McGuirk transfers to the strong candidates who don’t really need the votes. Totten gives a strong boost to Al-Zubi, but not enough, because a significant number go the the folks who don’t need them. Ai-Zubi’s strong feed to Joan nails it down, but it’s already decided. In 2019 our candidates won three Council seats: Carlone (I), Nolan and Zondervan. (We ran no School Committee Candidates). In 2021 our candidates won two Council seats: Carlone (I) and Nolan. We ran no School Committee Candidates) In 2023 our candidates won four seats Council seats: Nolan (I), Pickett, Toner (I), and Wilson. CCC candidates ALSO won two seats on the School Committee this year: Hudson and Rojas Villarreal (I). The fact that each year we were able to elect new comers is important since the weight of incumbency is so significant in our election system. Our goal has been to grow our numbers of elected officials slowly over time. So far we have been able to do this. Part of the success is the impact of a full set of endorsements. 2023 City Council Election Results Siddequi 1st count 2118 votes Burhan A 2nd count 2118 votes McGovern 7th count 2118 votes Patty Nolan 9th count 2118 votes Paul Toner 11th count 2118 votes Jivan S-Wheeler 15th Count 2118 votes Denise Simmons 16th Count 2118 votes Ayesha Wilson 17th Count 2118 votes Joan Pickett 17th Count 2010 votes Cathie Zusy 15th count 1159 defeated Dan Totten- 14th count 949 defeated McGuirk - 13th count- 873 Hanratty- 12th round- 728 Brown- 10th round- 460 Federico- 8th round 375 Winters- 7th round 311 Hao Wang- 6th round 265 Carrie Pasquarello- 5th count 247 Below are the preliminary votes and the impact of their transfers on other candidates. The first two charts are for City Council; the third chart for the school committee. What this shows in part is how important it is to vote for the various candidates on CCC's larger set of endorsees, because nearly all of them played a part in electing Joan Pickett, Patty Nolan, and Paul Toner. 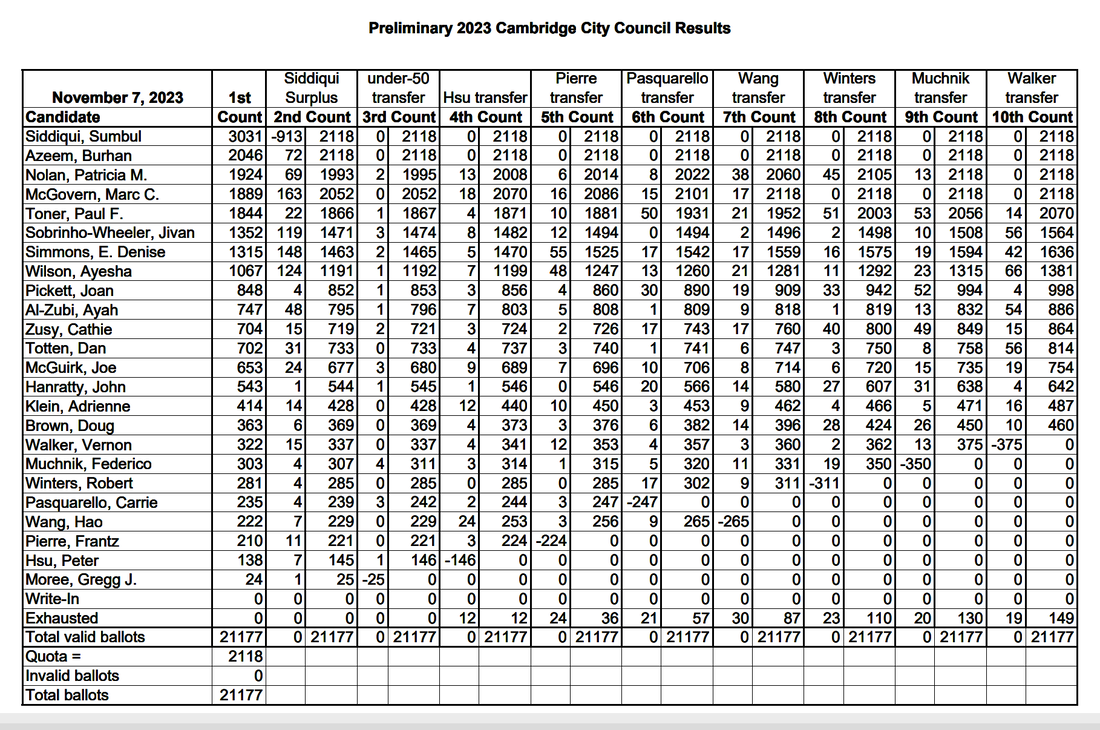 The second half of the City Council Election Transfer of Ballots: 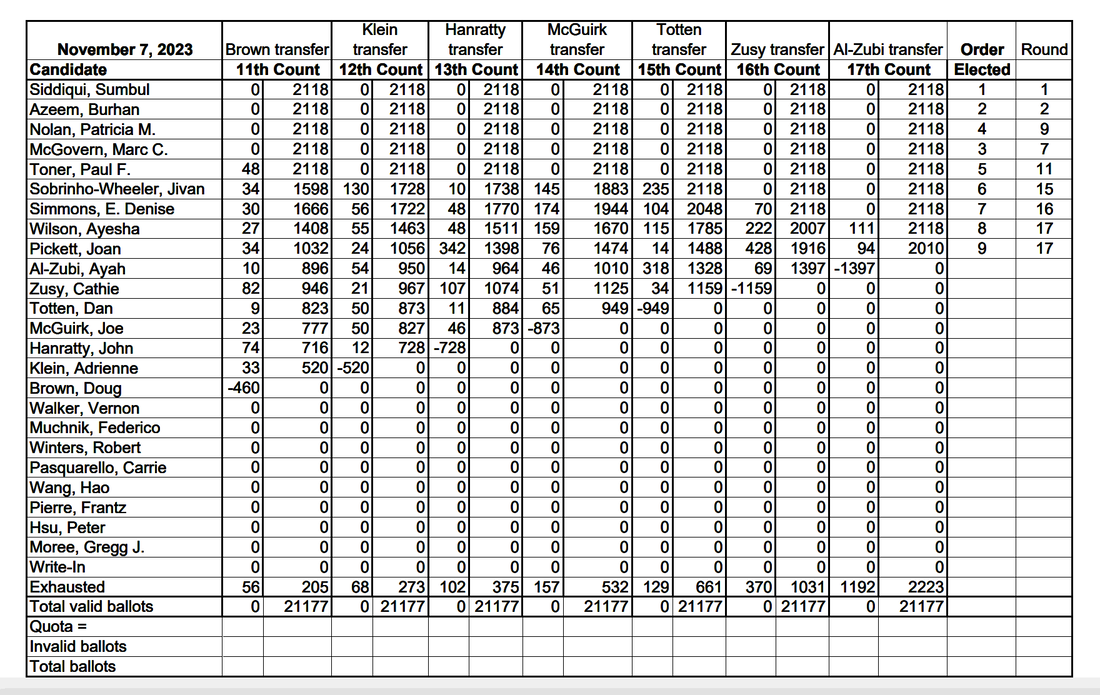 Below is the Preliminary Results of the School Committee Election. 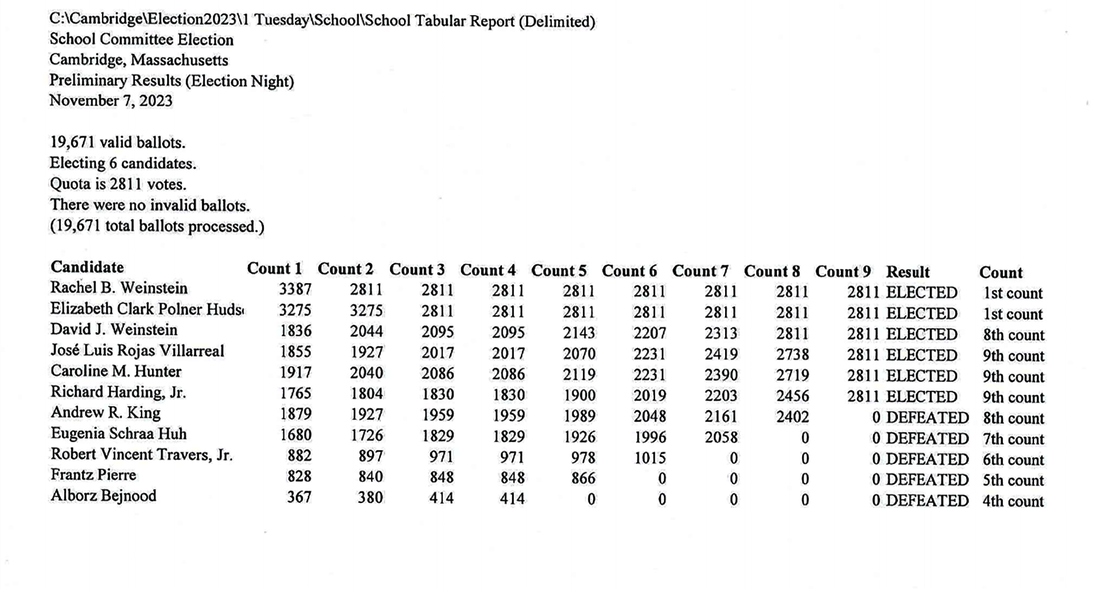 The key issue at play this year's City Council election cycle was better planning around bicycle lanes and a more holistic approach to transit. For this issue, CCC's candidates had major electoral success in the election of Joan Pickett. In the School Committee election, one of the key election issues was the return of algebra. In both these cases, your votes, and the successes of other important candidates (even those who did not win this election cycle) played a vital role.
This year not only were we able to replace two of the three open seats with CCC candidates (Joan Pickett Ayesha Wilson) and to provide a broader vision of transit for our streets. This election also helped move the needle toward less toxicity on Council thanks to these two Council decisions but also the election of Jivan Sobrinho-Wheeler instead of Dan Totten. With regard to the School Committee election, not only do our two candidate help bring closer attention to fully bringing back algebra to 8th grade, but also in gaining greater transparency and smarter policies around school schedules and parent involvement. In addition the School Committee often has been a key springboard for candidates seeking positions on City Council, as for example with Marc McGovern, Patty Nolan, and this year, Ayesha Wilson. Note: Cambridge has relatively high voter turnout compared to other cities in Massachusetts: The number of registered voters by precinct as of August 2023: 01-01 1456 01-02 869 01-02A 103 01-03 2132 02-01 2388 02-02 2052 02-03 1870 02-03A 198 03-01 2066 03-02 2244 03-03 1684 03-03A 759 04-01 2553 04-02 2126 04-02A 344 04-03 2380 05-01 2382 05-02 711 05-03 2153 06-01 1977 06-01A 514 06-02 1486 06-03 2492 07-01 2159 07-02 1657 07-02A 47 07-03 895 08-01 1900 08-02 2002 08-03 831 09-01 2897 09-02 2447 09-03 2415 10-01 1664 10-01A 1032 10-02 2662 10-03 2308 11-01 1194 11-01A 1084 11-02 2064 11-03 2210 11-03A 203 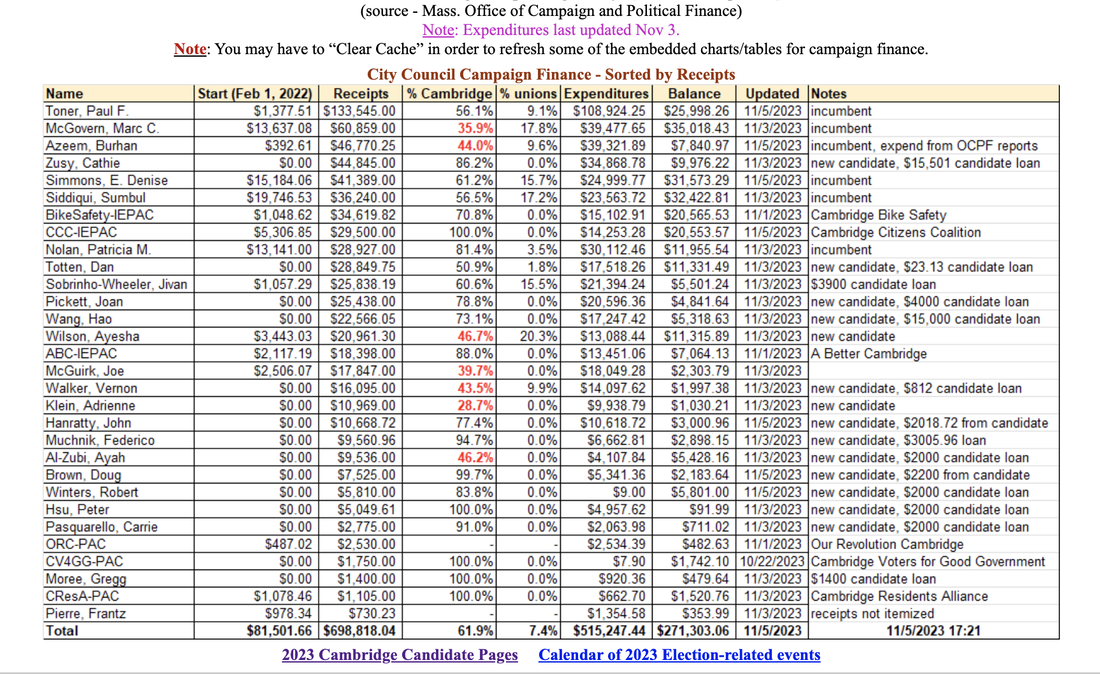 In the chart above we see data on the percentages of outside of campaign donations that have come from both within and outside of Cambridge through November 3. Source: Cambridge Civic: http://www.rwinters.com/
The higher the number means the more Cambridge-exclusive funding each candidate received. Generally speaking new candidates for office have a higher percentage of outside donors (family and friends), but that did not happen this year and CCC which has the greatest number of new candidates also has the smallest percentage of funds coming in from outside of Cambridge. Again this year the CCC-IE Pac donations are 100% local Cambridge sources. Note this year we did not calculate developer funds because Cambridge Civic did not include that category. They did include union funds (see the link above) and because CCC supports unions we chose not to address those funding sources, however a sizable proportion of these come from the building trades. CCC is highlighted in orange. The full names of the other groups are indicated below. Adrienne Klein 28.7% (ABC, BSC) Marc McGovern 35.9% (ABC, BSC) Joe McGuirk 39.7% (ABC, OR) Vernon Walker 43.5% (DSA, CRESA, OR, BSC) Burhan Azeem 44% (ABC, BSC) Ayah Al-Zubi 46.2% (DSA, CRESA, OR, BSC) Ayesha Wilson 46.7% (ABC, CCC, CresA, CV4GG) Dan Totten 50.9% (DSA, CresA, OR, BSC) Paul Toner 56.1% (CCC, CV4GG) Sumbul Siddiqui 56.6% (ABC, CresA, BSC) Jivan Sobriho-Wheeler 60.6% (ABC, DSA, CresA, OR, BSC) Denise Simmons 61.2% (ABC) Hao Wang 73.1% (CCC, CV4GG) John Hanratty 77.4% (CCC) Joan Pickett 78.8% (CCC, CV4GG) Patty Nolan 81.4% (CCC, CresA, BSC) Robert Winters 83.8% (CCC, CV4GG) Cathie Zusy 86.2% (CCC, CV4GG) Carrie Pasquarello 91% (CCC, CV4GG) Federico Muchnik 94.7% (CCC) Doug Brown 99.7% (CCC, CresA, BSC) Peter Hsu 100% Frantz Pierre ? (ABC BSC) If we compare the various endorsement groups we see they average out quite differently: ABC (A Better Cambridge) : 28.7, 35.9, 39.7, 44, 46.7, 56.6, 60.6, 61.2 (Missing Frantz Pierre). 373.4 = 46.7 OR (Our Revolution) 39.7, 43.5, 46.2, 50.9, 60.6 = 240.9 = 48.2 DSA (Democratic Socialists of America): 43.5, 46.2,50.9, 60.6 = 201.2 = 50.3 BSC (Bicycle Safety of Cambridge) 28.7, 35.7, 43.5, 44, 46.2, 50.9, 56.6, 60.6, 81.4, 99.7, 100 = 647.3 = 58.9% CRESA (Cambridge Residents Alliance): 43.5, 46.2, 46.7, 50.9, 56.6, 60.6, 81.4, 99.7 = 485.6 = 60.7 CV4GG (Cambridge Voters for Good Government) 46.7, 56.1, 73.1, 78.8, 83.8, 86.2, 91 = 515.7 = 73.7 CCC (Cambridge Citizens Coalition) 46.7, 56.1, 73.1, 77.4, 78.8, 81.4, 83.8, 86.2, 91, 94.7, 99.7 = 868.9 = 79%  The 2023 Cambridge Bicycling Data Report is out. You can also read it HERE. The array of graphs shown here are from this report. You can also view the citywide data itself HERE The good news is that the number of children riding bikes is increasing. But there are a number of other problems highlighted in this report One concern is that the city has not done the kind of data collection, analysis and reporting that is helpful to understanding how our bicycle policy is working and not working. The City's current approach to collecting bicycle activity is insufficient to provide a precise number. Indeed the City currently has only one location that counts cyclist activity 24 hours a day, 7 days a week and 365 days a year and that site is in Kendall Square (with a largely younger population). By comparison, Portland Oregon has over 70 sites that measures activity 24/7/365. Those who seek to show the positive side of this report often offer as key takeaways the view that. 1. People in Cambridge are biking more (23% increase in recent years). 2. Car ownership per household in Cambridge has steadily declined since 2000. 3. Bicycle crash rates and the number of serious injuries continue to decline and a reduction in bike riding on sidewalks. The report also does not address an array of other information that the 2023 Bicycling Data Report reveals including considerable unfortunate news for the city. Most importantly the data shows that: 1) the number of people driving alone in cars has increased 23% since 2018 (counter to the aims of our Envision Report goals; 2) transit use is down 30% in the same years; 3) carpooling is also down 32%. While there is an increase in bike ridership the rates remain stunningly low (at about 9%, up from c.7%). Stated another way, the "23% increase" in Cambridge resident bike riding commuters corresponds to an increase of just 1.6% of all Cambridge resident commuters (9% is a 23% increase from 7.4%) over the course of a DECADE (from 2007-2011 to 2017-2021). So too, cycling counts (and thus BMTs) have DECREASED by ~5% from 2019 to 2022 (~22k vs ~21k) despite an approximate doubling of the number of miles of separated bike lanes (~5.5 mi in 2019 to ~11.5 mi in 2022. The increased single driver car traffic coupled with fewer transit users and fewer traffic lanes, means that not only are people spending more time driving to where they need to go, but also a key part of that time is likely in increasingly clogged up streets adding to environmental harm. In addition as we will see, there remain MAJOR gaps in bicycle use in the winter months, during which time many fair weather cyclists are likely using their cars. 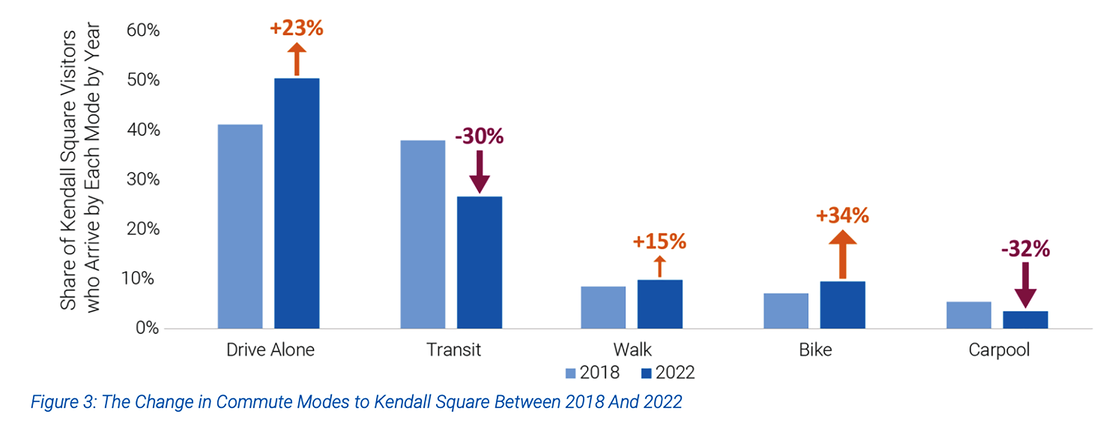 Another problem with the report relates to the bicycling safety numbers which are reported to have improved with separated bike lanes. However, unlike other categories of the report, the City appears not to have calculated for the COVID 19 period when far fewer cars were on the roads in Cambridge. And the City has not provided any concrete data showing the numbers of bicyclists riding on sidewalks in earlier years (much less with a year by year count). Moreover, nothing in the report addresses the demographic inequities that are in play here. As Anthony Gallucio notes on Nextdoor (Oct. 29, 2023) "It would be great to get demographic data on income and those that bike and drive. I know many lower income folks who do not have the privilege of working with in 5 miles of home and have sole child caring responsibility. They are all over the place and cannot afford parking. We talk about equity but only when it’s convenient.... It is a pretty perfect world when you can afford to live close enough to walk or bike to work.... If you live in public housing on Main Street you may not work in Kendall. You might have a ways to go and have to cart your kids around. Eliminating travel lanes doubles traffic back up (simple math). Eliminating parking has real burdens for car dependent residents....Its not a secret what the demographic is and where and when the demand is. The persons left out of this conversation are just trying to live... Lets just be honest about the drastic demographic differences involved here and ancillary needs and challenges." When we look at the data on bicycle riders and micro-mobile forms (scooters etc - probably younger riders and students) we see something equally noteworthy. Compare bicycle usage in 2016 and 2022 (8485 versus 8530) and you will see a whopping increase of 45 bicycle riders in that time period, despite all the city publicity about bicycle riding, bicycle lanes, and the city's push for people to replace their cars with bicycles. 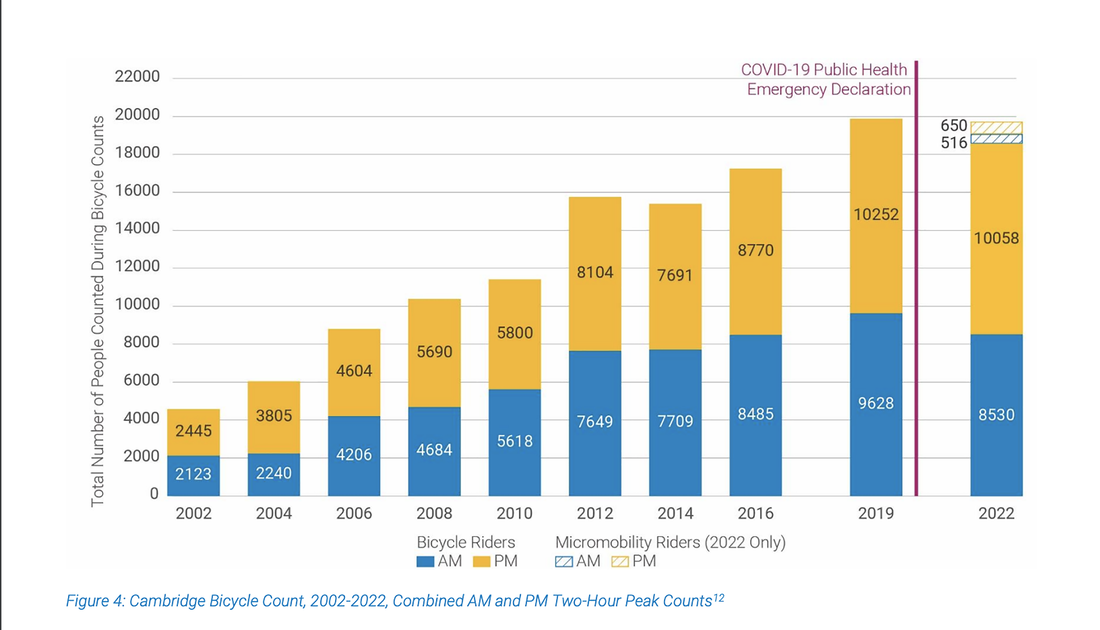 What the bicycling reporters generally also leave out is the vast differential in bicycle use between warmer summer months and cold and icy winter months. December, January and February when bicycle usage falls way off in Cambridge. In the winter months, those few cyclists who usually ride bikes to work, the doctor's and the grocery store, instead must find another transportation mean - most likely cars since public transportation use is now way down. During the winter months, the streets are critical for Cambridge residents and workers getting to work and other activities by car during the long winters months. During these winter months, car parking is also critical. 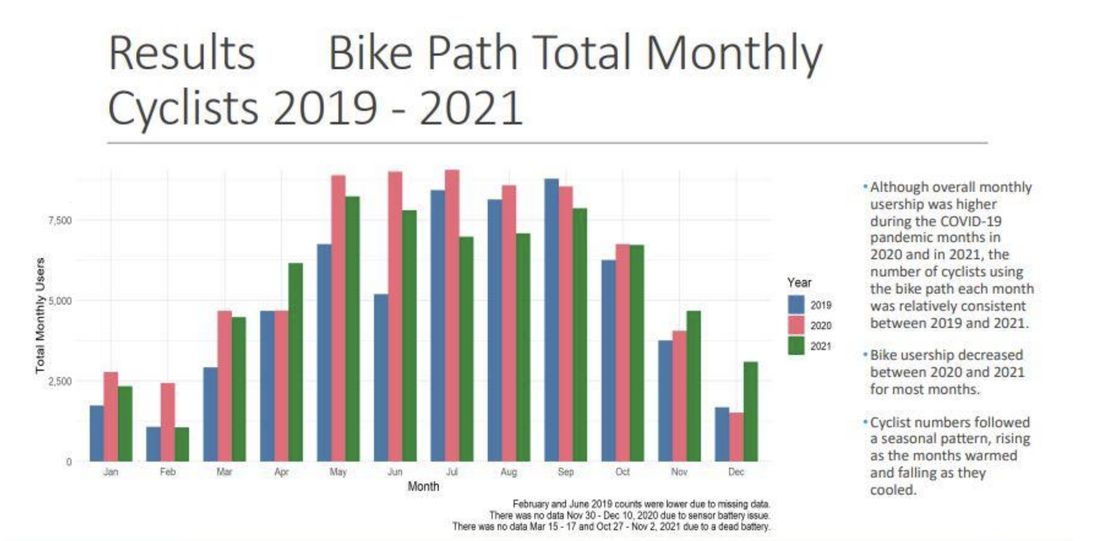 Much the same lower bicycle ridership in the winter months can also be seen in another included graph. What is clear in Cambridge is that we still need vehicle lanes in the cold winter months, even if, averaged out (including many students and tourists) the number of riders is slightly up. And based on the separate blue bike data significant part of the increased bicycle use during the summer months is due to increased area tourism. 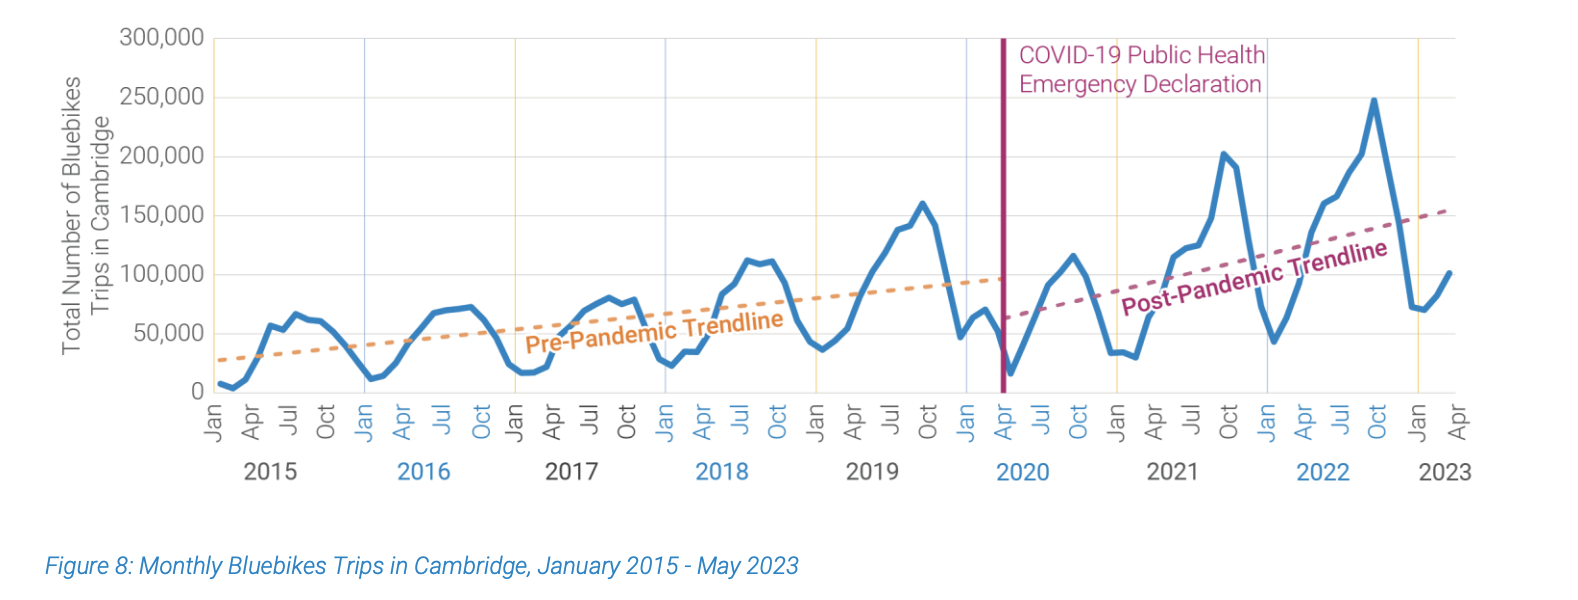 The city has spent an enormous amount of money on building out our bicycle infrastructure. As the below map shows, most of the city has nearby bicycle lanes now, with peak bicycle counts coming from several hubs - Kendall Square, Inman Square and North Cambridge (the latter near the Arlington/Somerville line). The question is how many more separated bicycle lanes we should add, and how many more critical car parking spaces the city should remove. Another issue that remains is where ride shares (uber/lyft) fit into this data. With the streets increasingly clogged and street parking harder and harder to find, those wealthy enough to use ride shares may likely are increasing this usage especially if there are time constraints or one needs to go where public transportation of simply walking is not a possibility. The data report does not appear to be addressing the wide share issue effectively. 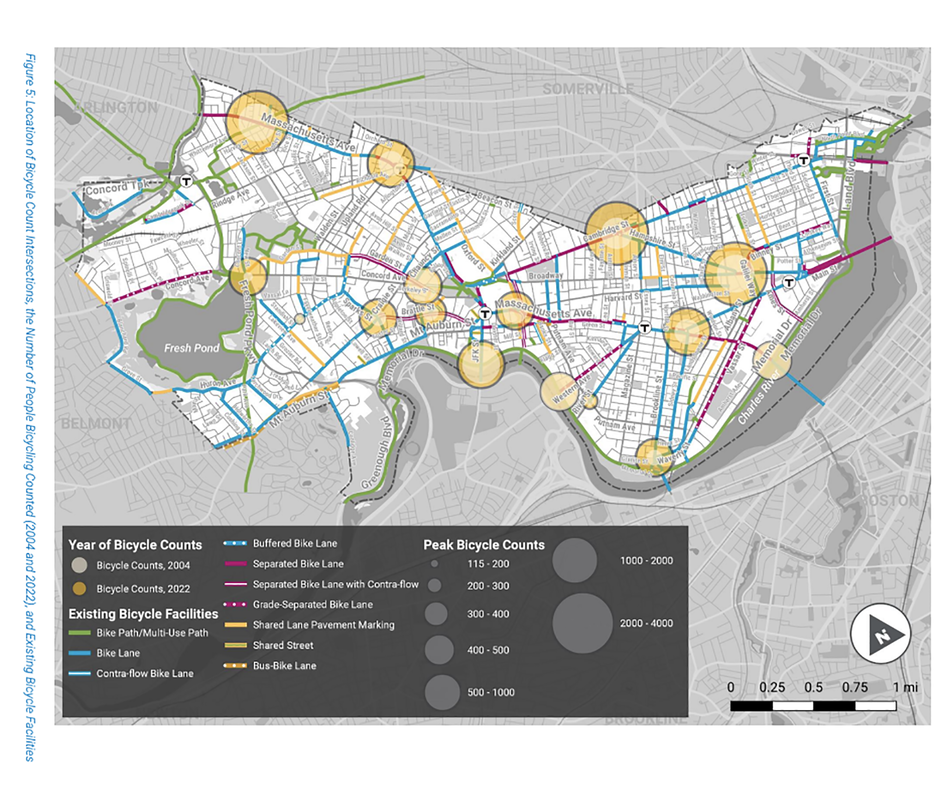 The business visitor data on bicycling use is also revealing. The percent of those who visit these businesses by bike remains small, probably even smaller when we analyze this data on a month by month basis. Inman Square the only one of these without a subway station does best. But no business can do well if one if clients who must arrive by car are decreased significantly. 75% to 85% of one's former business is not enough to keep the door open. What also would be important to know is which types of businesses tend to do better than others in this situation. My guess is that it would be restaurants and bars which tend to be open when other businesses (and needed car traffic) are closed. 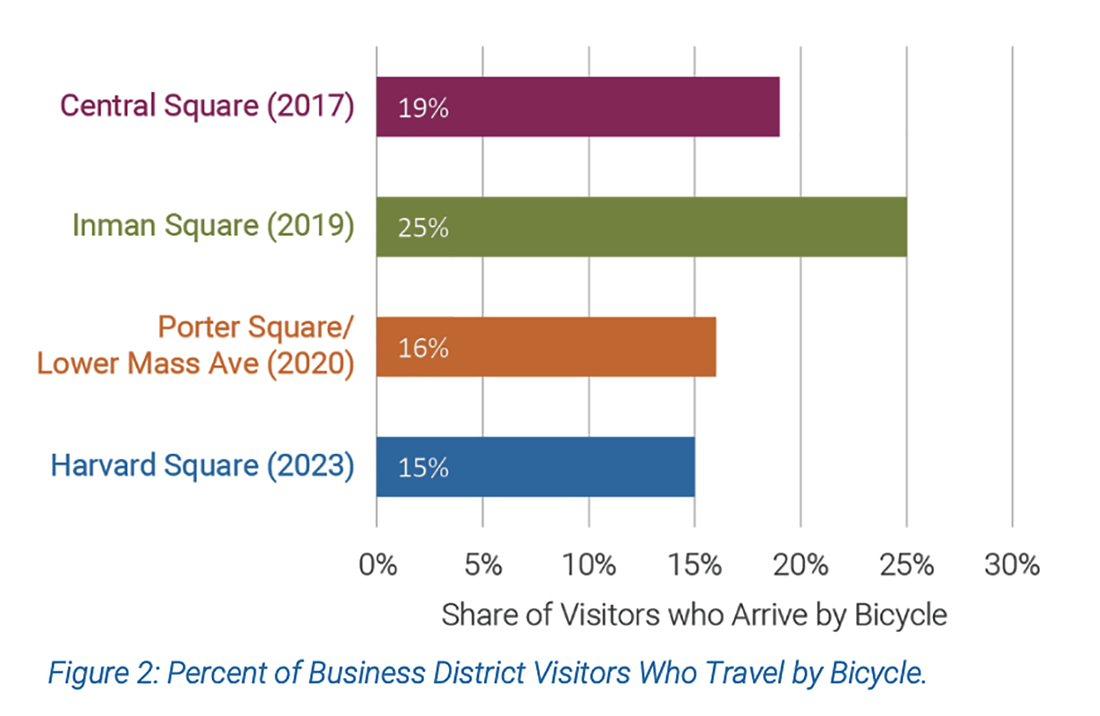 While there is positive news about bicycle crashes (and the severity of these) what also is clear is that there remain key areas of risk, especially in the most widely used areas of the city - North Cambridge, Kendall Square, Central Square and Harvard Square. And while the number of bicycles riding on sidewalks is said to have decreased, we are provided with no data on prior crashes involving bicyclists and pedestrians on sidewalks (or streets). Nor are we seeing data on the impacts on e-bikes and or e-scooters. 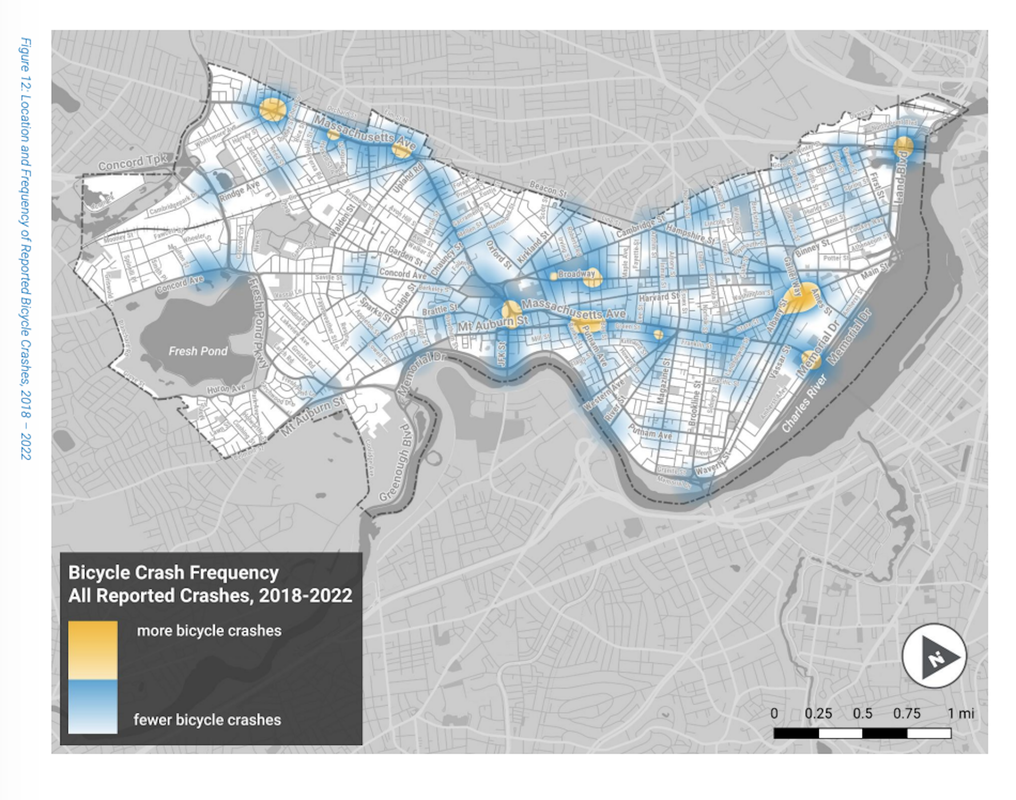 While it is good news that the bicycle injury rate appears to be significantly down, particularly for incapacitating injuries, the graphs make no accounting of the fact that during COVID vehicular use was also down. To really see what the before and after differences are we would need the COVID year indicator included in the graph much as was done for bicycle use and monthly bicycle use in the other graphs. One also wonders why e-bikes and regular bikes are not separated out in the data since in other cities (like NYC) this has been an important safety factor. And, based on the dates selected, it is not clear how much of the safety changes are due to the separated bike lanes as opposed to other factors including greater awareness of the importance of bicycling and vehicular safety by the city and by the bicycling advocacy group which is very active on social media and neighborhood list serves. It is noteworthy too that much of this data is based on self-reporting by bicyclists (who have been actively making this data publicly available), yet we have no comparable data on "no injury" or "possible injury" or "non-incapacitating injury" by pedestrian groups or individuals or even self-reporting by individual drivers or groups of drivers. It is great to see a 4.4% drop in incapacitating injuries between the selected years but here too further questions come up. Why these years; why compare an 8 year period (from 2004-2012) with a 7 year period (from 2015-2022), and since there are so few such situations of serious harm (a plus), it would be important to address them on a case by case basis regarding time of day, time of year, location, helmet use, and other factors. 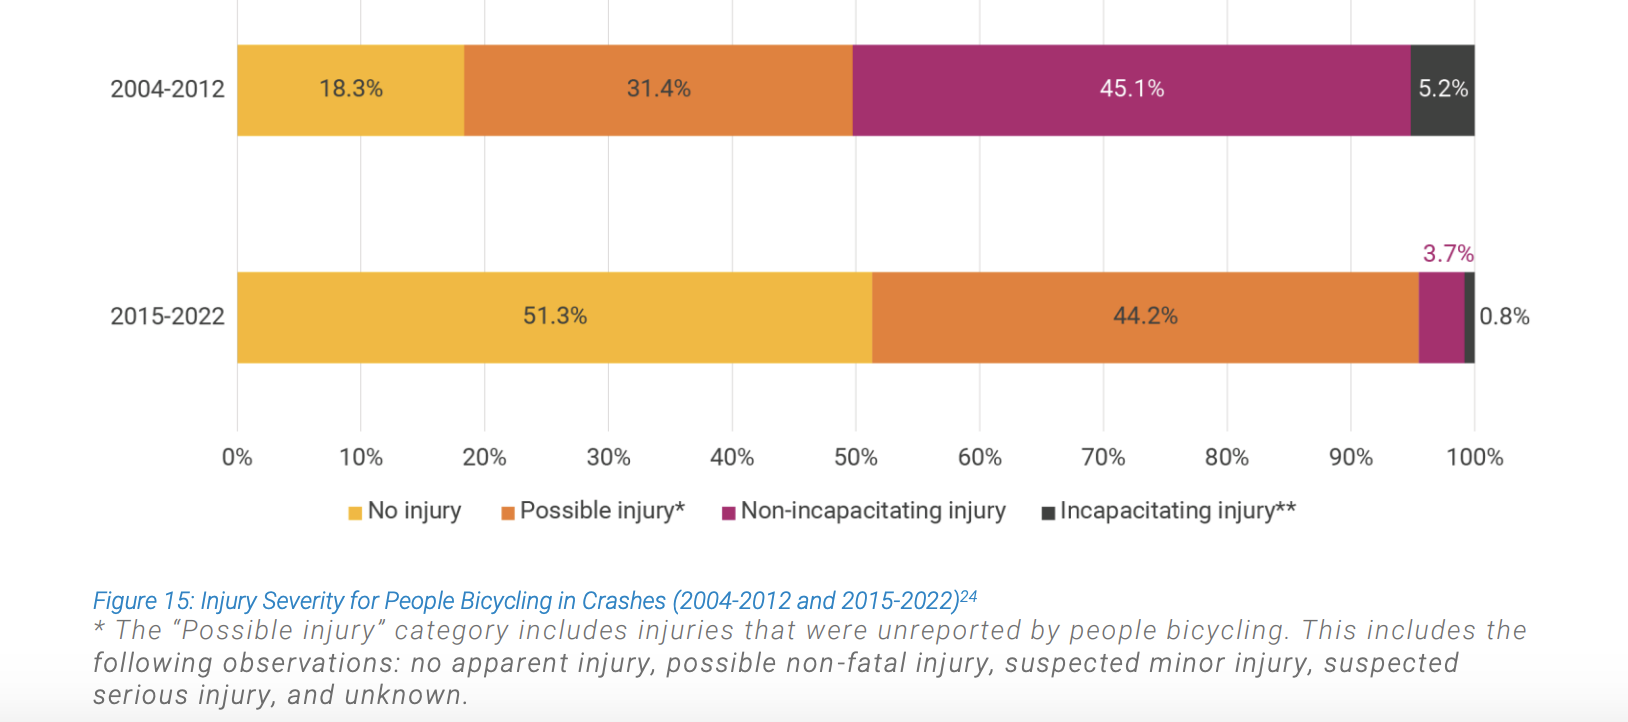 In the end, the 2023 Cambridge bicycle data report while important, also reveals an array of disappointments. What we see here, run counter to our Envision Goals of decreasing vehicle use. Instead we find that car use is up and public transit use is down. While we can't blame all the public transit woes on the city, it is not clear if the city did enough to keep critical transit routes in play in the recent metro shift in plans. Moreover what we also likely are seeing in this report is that some of the residents and workers most impacted here are lower and middle income individuals who need their cars to make a living. There are similar issues in play for many seniors and disabled residents. In the end we not only need far more city bicycling data (and a better presentation of the findings) but also a more holistic approach to transit in the city.
Yes, more children are riding bikes (a positive) but many of their parents appear to be still driving regularly for various reasons and need our streets to get where they are going and securing parking. Moreover, some 40% of Cambridge residents work from home (likely among our wealthier residents) and we have no evidence that they are letting go of their cars and bicycling where they need to go. So while this report is welcome, hopefully the next one will come with a far more complete set of data (24/7/365 throughout the city) and better reporting of it. And, in the mean time, since reducing vehicle traffic in the City is a key goal of the Envision report it is clear that adding a large infrastructure of bicycle lanes to date has not so far factored positively in this.  The one and only Jimmy Tingle has again interviewed Cambridge Candidates for City Council and School Committee. Below are links to CCC's 2023 endorsed candidates. JIMMY TINGLE CCC CANDIDATE INTERVIEWS (2023)
SCHOOL COMMITTEE CANDIDATES Elizabeth Hudson: HERE José Luis Rojas Villarreal: HERE Robert “Bobby” Travers HERE CITY CANDIDATES (more interview links to follow) Doug Brown: HERE John Hanratty: HERE Federico Muchnik: HERE Carrie Pasquarello: HERE Joan Pickett: HERE Paul Toner: HERE Hao Wang: HERE Ayesha Wilson: HERE Cathie Zusy: HERE Here is a link to all the Jimmy Tingle interviews Cambridge City Council and Cambridge School Committee Candidates for 2023. https://www.jimmytingle.com/meet-the-cambridge-candidates-for-2023 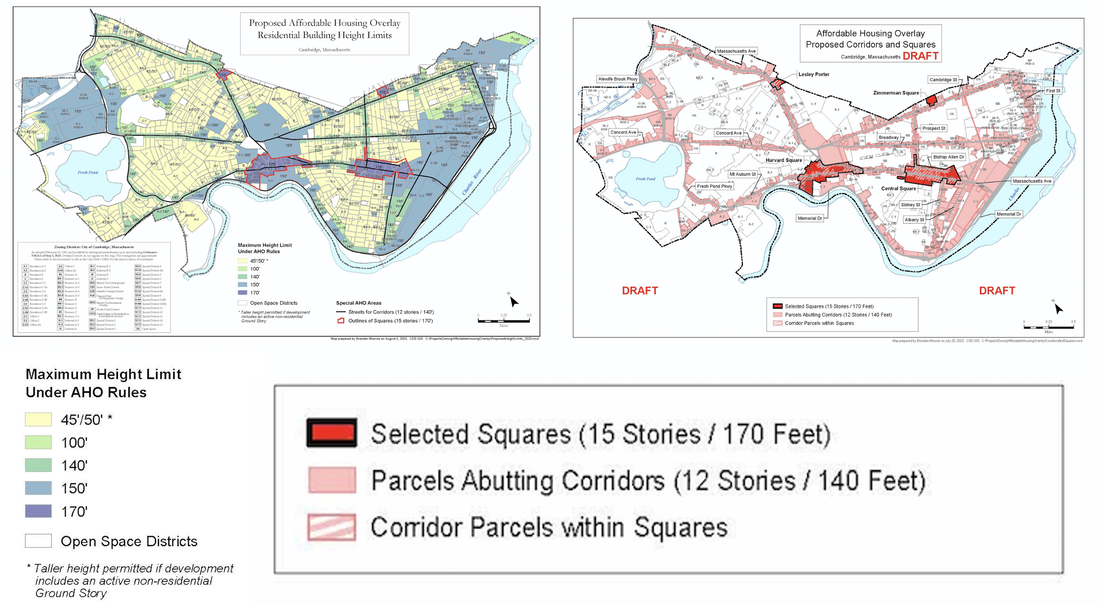 The Citywide upzoning for tall income-limited highrises known as AHO 2.0 will likely be voted in by City Council on October 16. Maps are now available. City Councillors supporting this large citywide AHO 2.0 up-zoning are Councillors Azeem, McGovern, Simmons, and Siddiqui as well as Mallon and Zondervan (the latter two are not running for reelection). City Councillors who oppose AHO 2.0 include Councillors Nolan and Toner as well as Carlone (the latter not running for reelection). CCC-endorsed Candidates who oppose AHO 2.0 include: Brown, Hanratty, Muchnik, Nolan (I), Pasquarello, Pickett, Toner (I), Wang, Winters, and Zusy Likely Impacts: removal of historic Cambridge homes and other buildings, loss of mature trees, and critical green spaces. With no parking or required drop off areas, traffic and parking problems will likely increase. Without our standard Planning Board large project oversight of AHO building design, these new large scale structures may not meet the level of design oversight of other city large projects - or neighbor input. For AHO buildings, the Planning Board role is only advisory not mandatory unlike other projects. Adjacent homes and other buildings will be impacted by the 12 and 15 story buildings being erected which will block sunlight to neighbors and many blocks away. With little if any financial oversight, the new AHO units likely will cost tax payers nearly $1 million apiece (even without land costs) -double what market rate housing costs). City Council Candidate Federico Muchnik has written a letter to local press on this material: HERE Muchnik, a well-known local filmmaker has done a number of documentaries on this issue and other subjects: https://www.federicoforcouncil.net/films
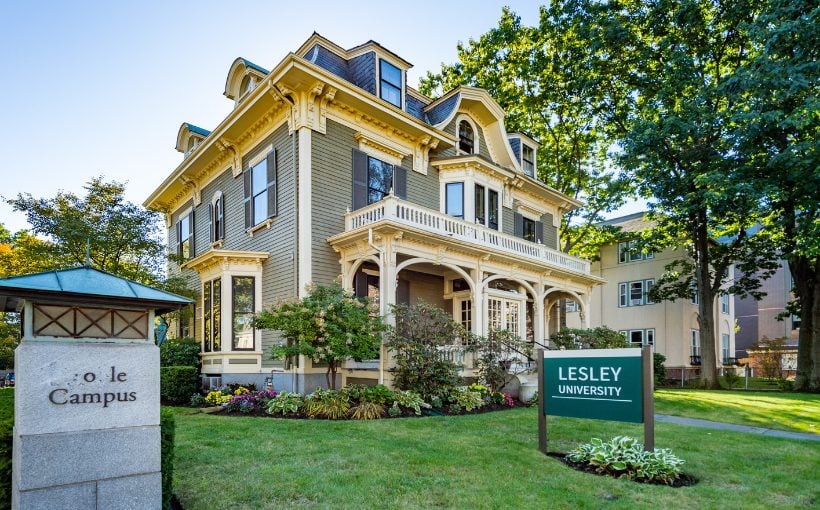
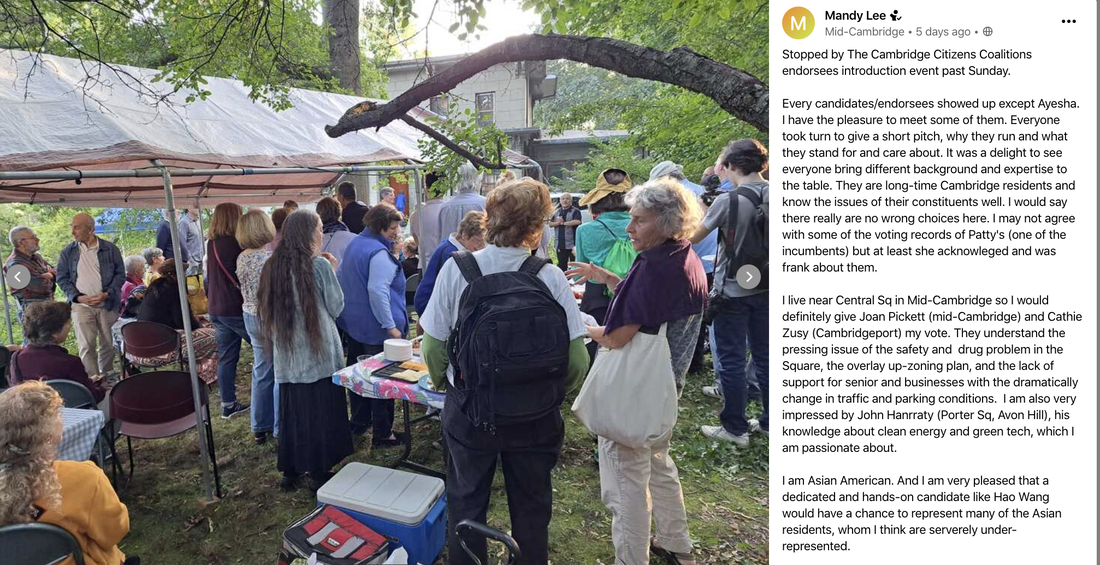 On October 1, 2023 4:30-6:30 CCC held its first candidates event at the Mid-Cambridge home of Sara and Larry Berman - the site of many important campaign launches. The images and text below were posted by Mandy Lee on Next Door (and are republished here awith her permission. Stopped by the Cambridge Citizens Coalition endorsees introduction event [this] past Sunday. Every candidates/endorsees showed up except Ayesha [Wilson who had a prior conflict]). I have the pleasure to meet some of them. Everyone took turn to give a short pitch, why they run and what they stand for and care about. It was a delight to see everyone bring different background and expertise to the table. They are long-time Cambridge residents and know the issues of their constituents well. I would say there really are no wrong choices here. I may not agree with some of the voting records of Patty's (one of the incumbents) but at least she acknowledged and was frank about them. I live near Central Sq in Mid-Cambridge so I would definitely give Joan Pickett (mid-Cambridge) and Cathie Zusy (Cambridgeport) my vote. They understand the pressing issue of the safety and drug problem in the Square, the overlay up-zoning plan, and the lack of support for senior and businesses with the dramatically change in traffic and parking conditions. I am also very impressed by John Hanrraty (Porter Sq, Avon Hill), his knowledge about clean energy and green tech, which I am passionate about. I am Asian American. And I am very pleased that a dedicated and hands-on candidate like Hao Wang would have a chance to represent many of the Asian residents, whom I think are serverely under-represented. Didn't get a chance to chat with Federico, Doug, Carrie, and Bob. I will look out for another event to go to find out more. But based on their short introductions, I would feel very comfortable circling them in. Last by not least, I am delighted Paul Toner was there. It is not a surprise why so many of my neighbors love him and say vote them all out (the current city council) except Paul. I don't know how exactly whom I would vote for or in what order just yet. But I can tell you right now whom I would absolutely not vote for: Dan.... For 20-30 minutes [at the] beginning of the meet and greet, there was an angry [...group], summoned by Dan, screaming, protesting, trying to drown out the meeting. I don't know what the beef was about as I came late. Regardless, I find this tactic and intimidation appalling and repulsive. You may not like a candidate, or what they stand for. You resolve it in a civil manner, and not by verbal assault. It achieves little except completely turning off voters. I can just imagine him being this confrontational at the council, representing a few radical activists, instead of working and compromising with other people who happen to have different opinions and backgrounds for the general population. [Ed. note: The small protest wasorganized by the above mentioned candidate, someone who has been endorsed by the Democratic Socialists of America (DSA) and Our Revolution, leaders of which were part of this effort to derail the event. This small group of protestors left well before the candidate presentations. The best reporting of the event was done by the Harvard Crimson]. Prior to this event this same candidate boasted on social media that he had turned down CCC's endorsement of him; no such endorsement occurred. Councillor Denise Simmons has called for more police security at Cambridge polling places around the city during this election in part as a result of these kinds of incidents: HERE. In response to some of the noise in play this election we also want to take this opportunity to reaffirm who we are: WHO WE ARE...Cambridge Citizens Coalition (CCC) was founded by local neighborhood group leaders and is led by them along with other local civic activists and residents dedicated to smart development, thoughtful city planning, good governance policies, sustainability, housing affordability, and the preservation of our trees, green spaces, and historic architecture. CCC stands with the LGBTQIA+ community’s fight for equality. We are committed to ending anti-LGBTQIA+ violence, bullying, and discrimination, and to ensuring that LGBTQIA+ individuals are treated with dignity and respect in their communities, their workplaces, and their schools. CCC believes in nurturing growth and positive change for individuals and communities alike. We stand with and advocate for equity and social justice for indigenous communities, people of color (BIPOC), those with disabilities, others who have been marginalized and individuals practicing every religious faith. This statement is posted at the top of the main page of our website. For the most part we stay clear of social media. 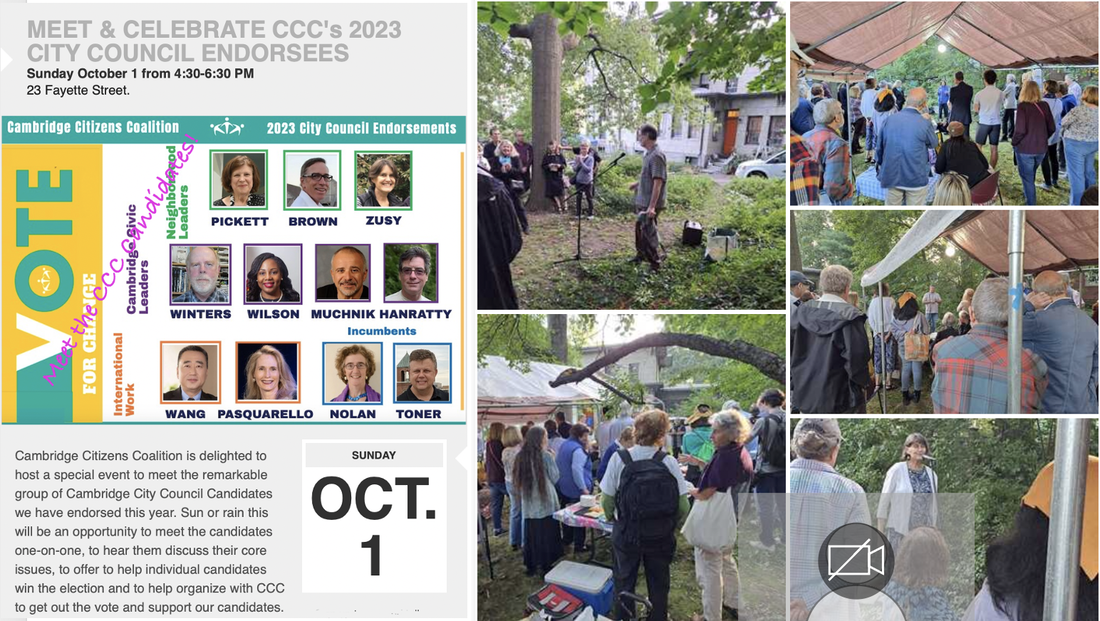 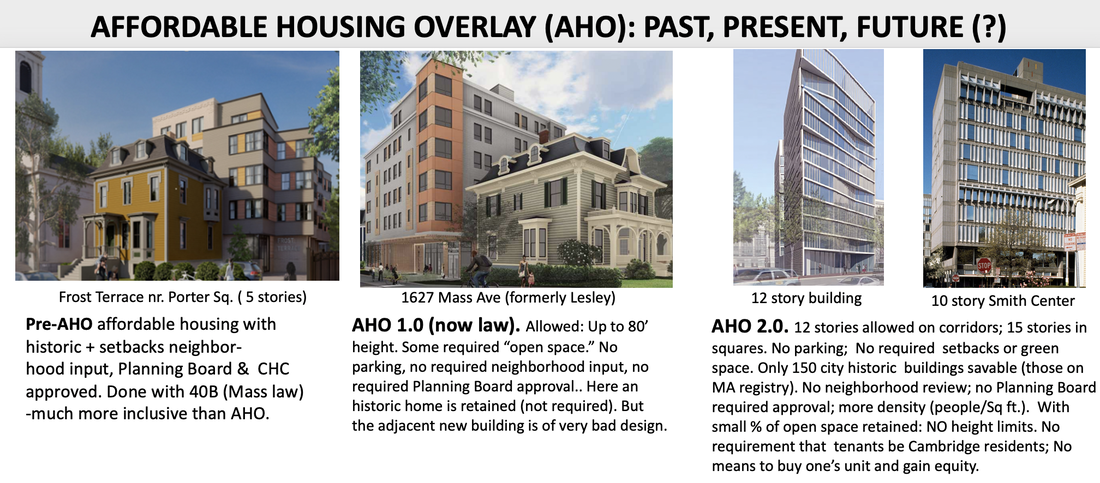 In 2021 CCC published a First Year Report on AHO 1.0 - its impacts, successes and failures: HERE Key takeaways of our 2023 Third Year Interim AHO report: already we are seeing the impacts of AHO 1.0 and even the AHO 2.0 currently under discussion and they often are not positive. Yes there are some successes, such as the repurposing of the former Sacred Heart Convent and School in East Cambridge and the fact that there are now some 1500 affordable housing units in the works. Another success has been the New Street development near Danehy Park, a project that preceded the AHO passage as a result of an intervention by then Councillor Jan Devereux to switch a proposed storage container building to affordable housing. We are also seeing more clearly now what happens when we have little viable accountability and oversight by the Cambridge Housing Authority and the city itself. Jefferson Park will cost nearly $1 million per unit to build (far more expensive than market rate housing units cost). And here there was no need to purchase land, since here they are simply rebuilding the existing structures at double the density and at greater height. In addition theses developments are sometimes very poorly managed, with so many complaints that the Mayor and Vice Mayor wrote a letter to the Cambridge Housing Authority to complain about the management of Walden Square. In some respects these examples serve as a canary in the coal mine in offering more clues about what will happen here if the AHO 2.0 is passed. Blog Update (July 19, 2023): The Planning Board met on July 18 to discuss the AHO project at 1627 MA Ave -Lesley (see central image above): To the person, the members critiqued the design plans, calling it a massive cube with little relationship to the adjacent house they are preserving. It is twice the height of neighboring houses. One noted that each AHO unit costs $1 million and still it looks like the developers are "holding back...trying to keep something in their wallet." Another member observed that the "developers should step up their game and bring a better product." Still another noted that we and the residents deserve excellent design. The former Planning Board chair pointed out that the AHO process currently is flawed, and the AHO developers are presenting only the most basic plans and not doing the actual work of designing. Other Board members concurred. A number of neighbors, all supportive of affordable housing, were deeply concerned about the plans. They have submitted a long report. Alas, as one Board member noted, few of the neighbors’ concerns have been addressed by the developers. The system is clearly not working. The Planning Board will again take up this project at a later meeting. Compare / ContrastOne thing we noted in our 2021 AHO report is the tendency of affordable housing developers to use the AHO 1.0 Ordinance, not to buy new property (competing successfully with for profit housing developers and commercial interests successfully), but rather to simply rebuild on their existing properties. They are removing critical green spaces, mature trees, and play areas in order to double the size and density of these properties. As we can see below, the same thing is happening today in the Walden Square 2.0 property. What is also happening now, is that developers are going well outside the design criteria stipulated in the AHO 1.0 (see both the Walden Square 2.0 and the 1627 Ma. Ave. AHO project discussed before it). Good design and best practices in both cases are thrown out the window and since there is no independent city accountability for official AHO projects (the Planning Board is simply advisory not enforceable). And with AHO 2.0 now in final discussions, some AHO developers have decided simply to wait it out until the ordinance passes to achieve whatever height and density they want. Rarely do we get to see direct impacts of our AHO (Affordable Housing Ordinance) zoning regulations in such a direct way as in the building project now in play at 1627 Mass. Ave. This AHO development comes to the Planning Board for discussion (no approval necessary) on July 18, 2023. This project (see the center photograph above) engages a stunning historic home that most recently was part of Lesley University's campus. The larger project is a perfect example to compare the impacts of different modes of affordable housing in Cambridge: pre-AHO affordable housing (Frost Terrace top left), AHO 1.0 (top center), and the proposed AHO 2.0 (citywide AHO amendment - above right images). The pre-AHO Frost Terrace affordable housing complex works well by integrating the new design with the older building and adding facade detail and interest to the new structure. It also incorporates core (required) AHO design criteria unlike 1627 Mass. Ave. City Council will likely vote to approve AHO 2.0 at the August 3 full council Ordinance Committee. It could then come up for Council final approval votes at some point between September and October. The citywide and neighborhood impacts will be sizable, made worse by the fact that without any real design oversight (Planning Board or other), even the ordained AHO design criteria of AHO 1.0 may not be followed. Builder- and developer-aligned Councillors are now a Super Majority on City Council, a group that also includes the Mayor. They appear to have the votes to support this radical, vastly out-of-scale AHO amendment. Lets look at the differences more closely: 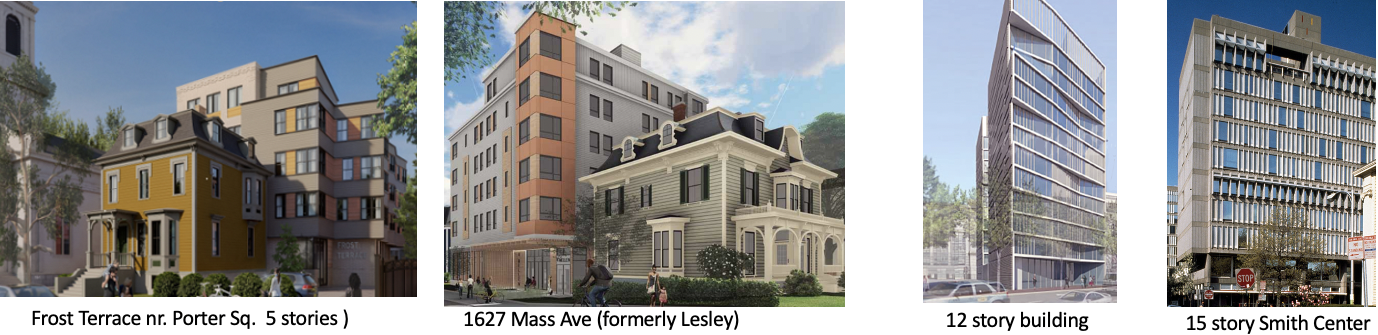 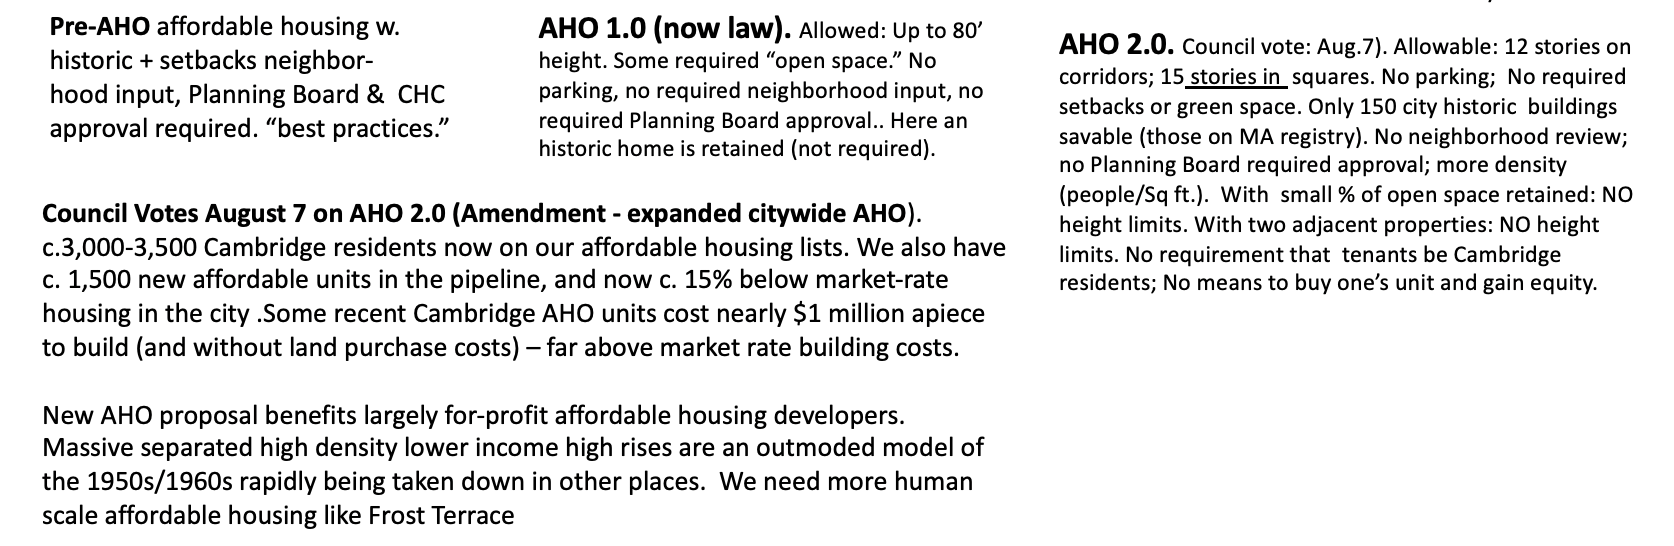 A Majestic Landmark with a Bulky Box Addition1627 Mass Ave. is a stunning Cambridge historic building that found primacy of place on the Lesley University campus. It is wonderful that it is being preserved, and what a great option to include it in a larger affordable housing development here - very close to the Porter Square subway entry and ample grocery and other shopping.
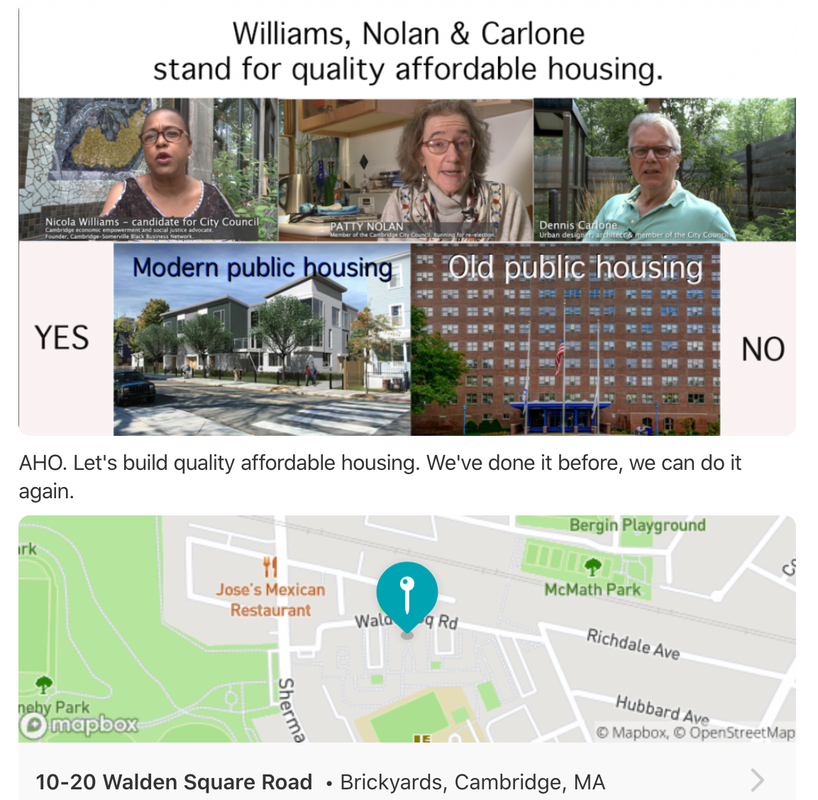
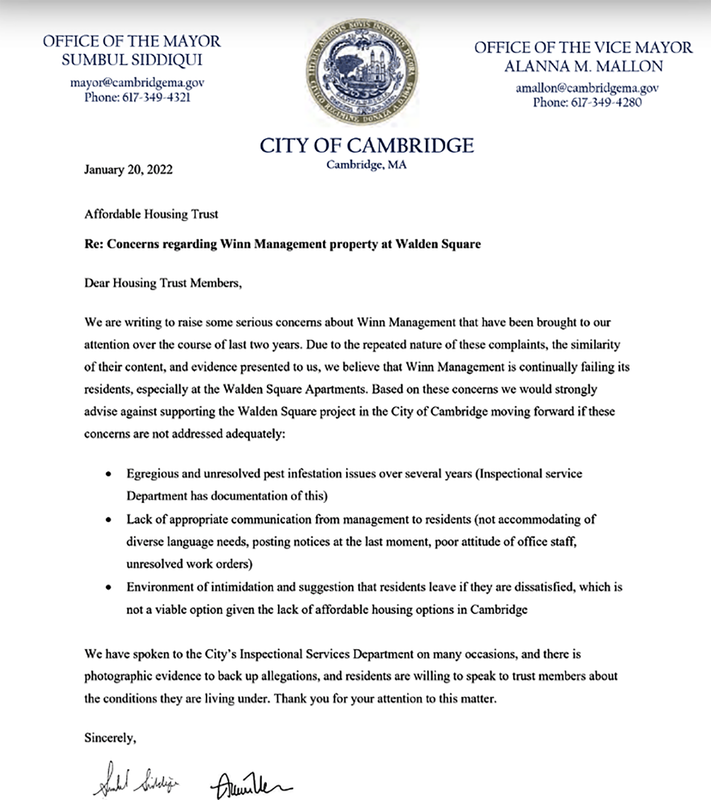
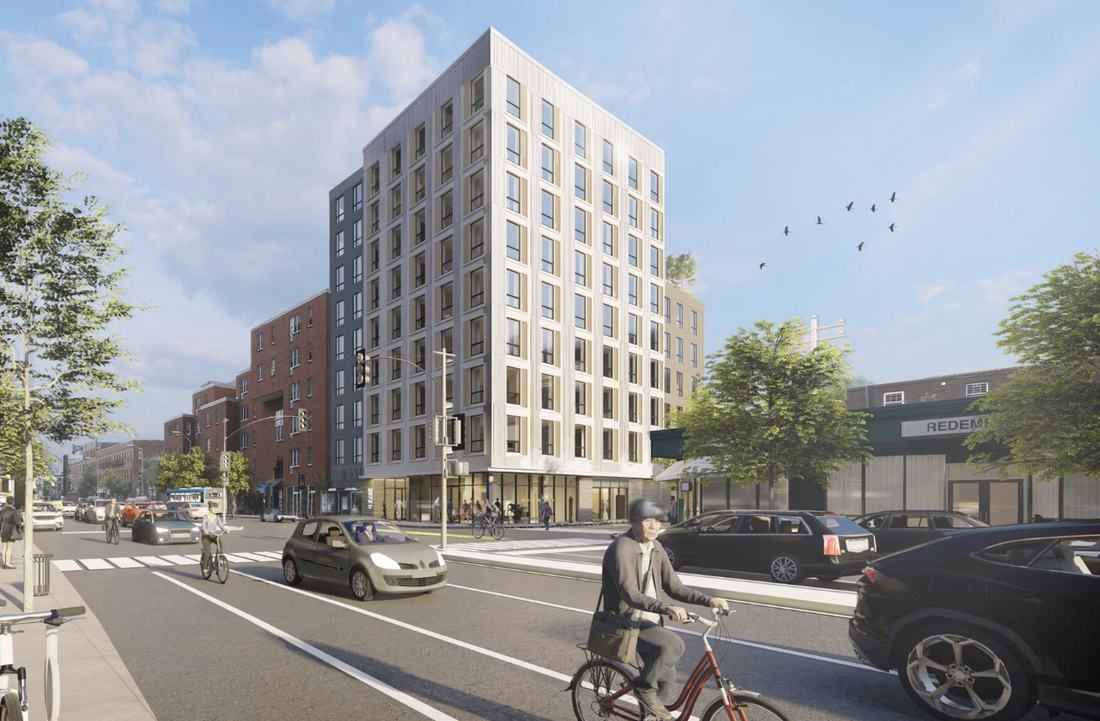
The site along a wide avenue, near a subway stop, and AHO need are not in question. What is in question is the overall design of the proposed new affiliated structure. The Urban Design Review (see tab below) notes that scale of the new structure is completely out of keeping with the neighborhood homes and the facade design, materials, and other features are not only problematic but go well beyond what is allowable in the AHO 1.0 design criteria with which this building is supposed to legally conform. Alas with AHO 1.0 there is no required Planning Board design oversight (the Planning Board's role is merely "advisory") so likely there is very little will be changed, and its massive scale and disproportional height, scale, and facade detailing in the context of neighboring homes will be irrelevant. For more on the plans themselves see the CDD tab below and beneath it the renderings and cross sections. What is clear from each of these images is how disproportional and out of scale the structure is (a massive flat-top box) that dominates its setting and the houses around it. 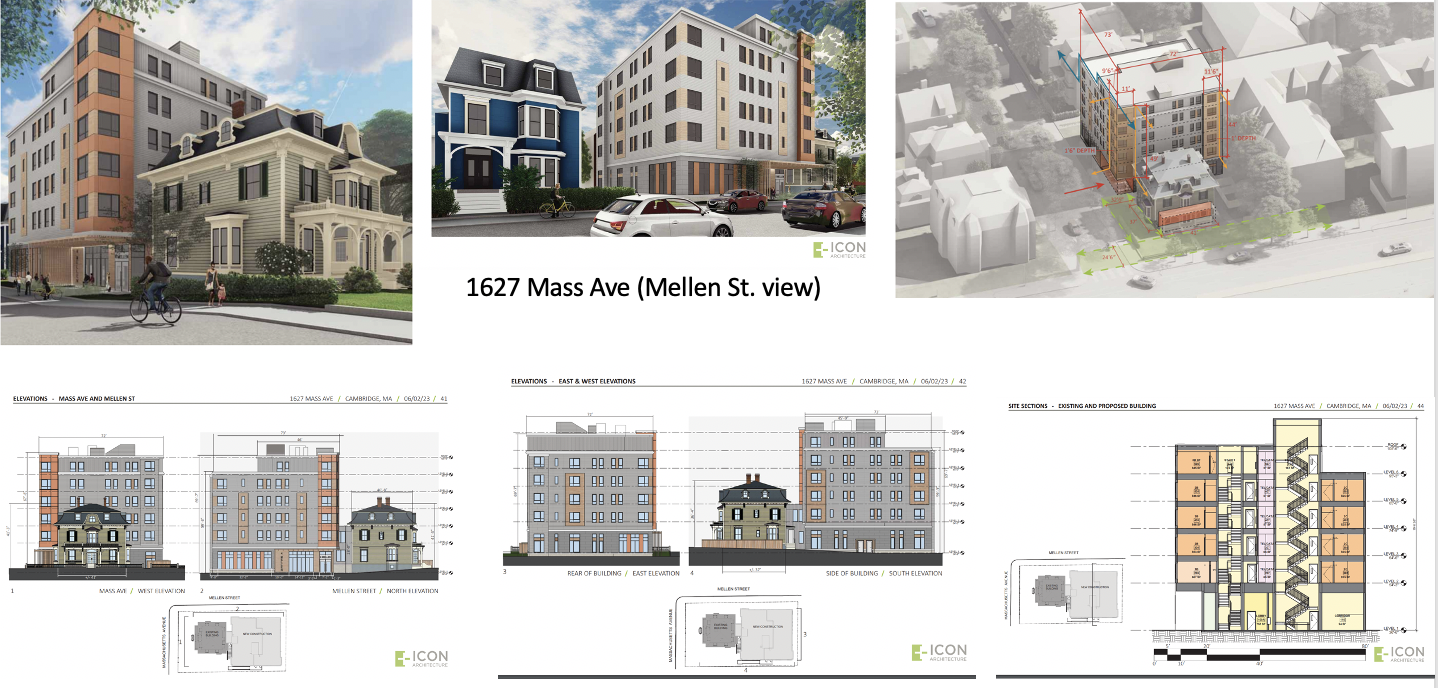 The Urban Design Report (see tab above) notes that this structure’s bulky “cubical block” form which is twice the height of the historic Second Empire style building that is part of this property “…will have a major impact on the character and scale” of Mellen Street “…which is lined by mostly two and three floor residential buildings.” Furthermore, this addition does not conform with the AHO guidelines which “emphasize that the massing and facades of new buildings should be compatible with the prevailing pattern of neighboring buildings and open spaces.” Setbacks also are encouraged along with façade designs that “…encourage compatibility with the architecture of the immediate context: the use of details, materials, and elements that add visual interest….” According to our AHO guidelines “new projects should be responsive to the existing pattern of development. Heights and setbacks that provide suitable transitions to lower scaled areas should be considered. Buildings should be designed and oriented on the lots to be consistent with the established streetscapes.” Another problem with this development is that it includes only one elevator (lower right image), so when it is broken (which often happens, and sometimes months on end) seniors, those with young children, and those who are disabled may have to trudge up 5 stories of stairs with groceries, strollers, and other necessities. Since those who live here will need to work to afford the more modest rates, getting to these jobs, or to doctors appointments and other necessities, will likely mean parking on the already overburdened streets. Shadows, green spaces, and trees. One of the most important factors in impacting climate change and diminishing heat island impacts is the shade provided by mature trees in the city and other greenery. A quick look at the shadow study provided by the architect of this AHO addition reveals that the negative impacts will be significant, making it very difficult for trees to grow and survive here. This goes against key goals of environmental equity. 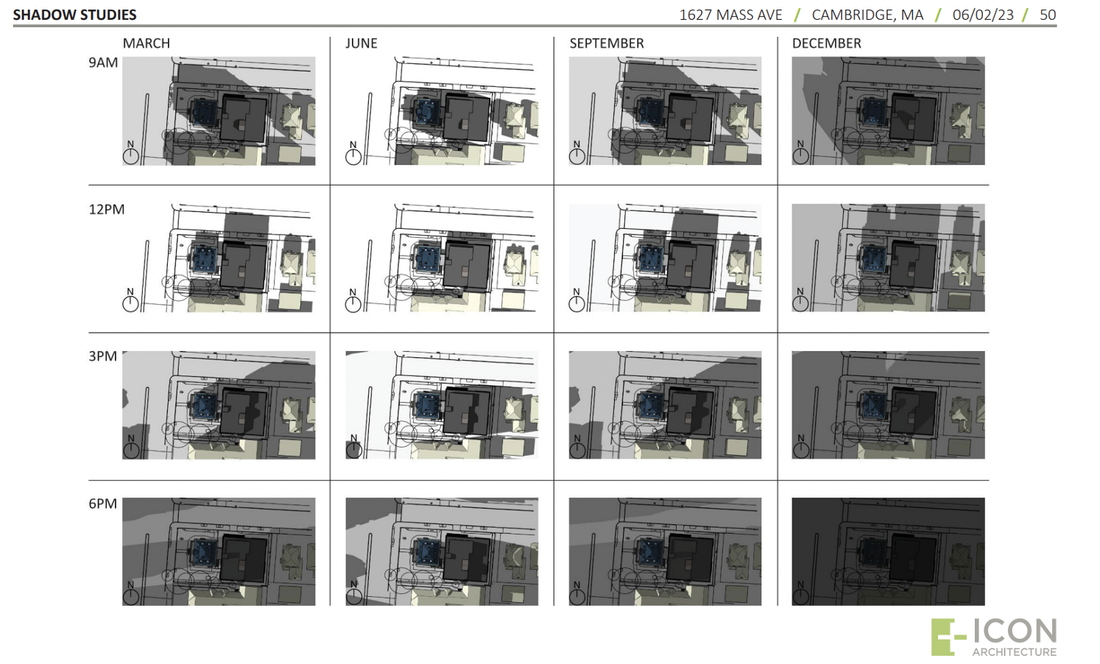 Light, and trees, and green spaces are critical for health and well-being but this is clearly not factored in here. The architectural firm in question (Icon - located in Mason, Iowa), has undertaken a number of very dense housing projects that often have a shared "affordable housing" look (large, boxy structures with bland facades and materials). They also do dorms, prisons, and commercial or municipal projects. but some of their projects move a bit beyond this (see below). For an important structure such as 1627 MA Ave., situated in an important Cambridge residential area, a more creative, contemporary, and possibly bold design should be brought into play. Good or even great design does not have to cost more than the now standard U.S. low-income housing model that the 1627 MA. Avenue project now evokes. Another attractive affordable housing design is 2072 Ma. Ave (see below) although it was too large for the site, and had too many non-conforming features with state laws to proceed. The Slabs at Walden Square (WS 2.0)The 1627 MA Ave AHO project is not the only city affordable housing project that reveals how recent Council housing decisions are impacting affordable housing design. Walden Square on Richdale Avenue in North Cambridge, by Winn Properties - a for profit affordable housing development firm that often does Army barracks) is another important example. Winn is moving forward (with the city’s tacit acceptance) with a series of buildings amounting to a 100 unit complex at 2 Walden Square. The site is doubling its density (population and size) removing key play, green areas, trees, and parking, and making access to Danehy Park nearly inaccessible now for neighbors. The next community meeting on Walden Square 2.0 is scheduled for August 1 at 6 PM (see link below for zoom). The last event had to be cancelled, and one of the public concerns was that no fliers had been posted for the residents (so none knew this was happening). The slide deck by Winn for this project can also be found at the link. Like 1627 MA Ave., the Affordable housing project at Walden Square which is being completed under the AHO 1.0 goes well beyond allowable design and other criteria of this zoning ordinance. But since the Planning Board and neighbors have no real input in the result (except minor advisory) how much will change is unclear. The July 12 Public meeting had to be cancelled due to city power outages. The next meeting is August 1. 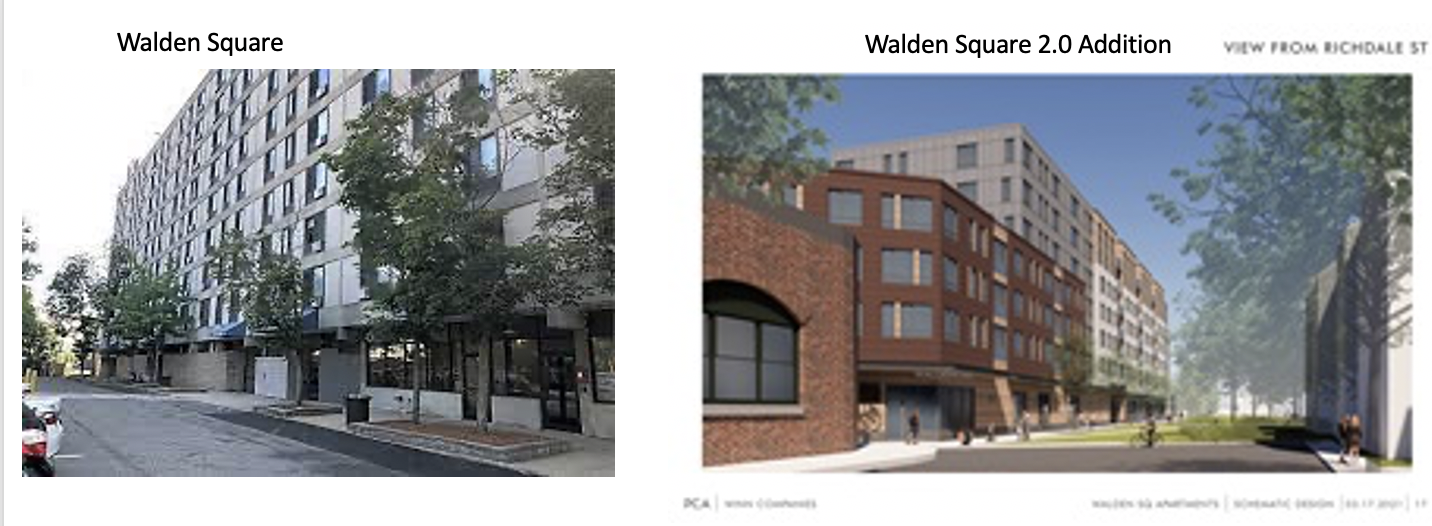 Walden Square today (left) and drawing of the addition that encloses this structure in Walden Square 2.0 (right). Images from the Walden Square Video (see tab below). 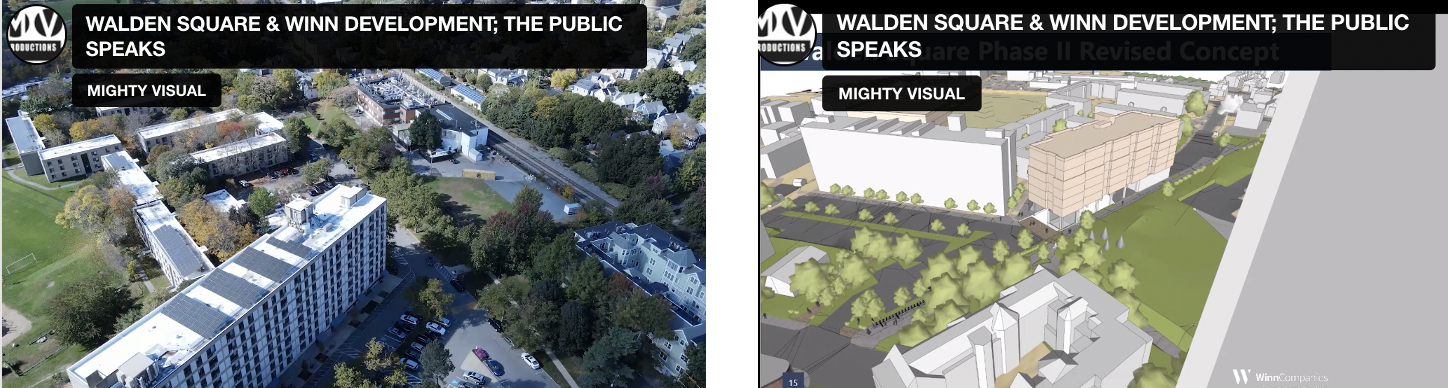 This project despite massive resident and neighbor opposition is now in play for a design that includes a slab 85 feet tall and 450 feet long at the edge of Winn property, wrapping around an existing nine-story building, and removing key green spaces with seating, a children's play area, mature trees, and parking. In mid-July 2023 Winn is scheduled to hold its required community meeting. The revised plan obliterates a tot lot and crams the half of the original building removed from opposite the condo project into a space inside the Walden Square development where it crowds buildings already quite jammed together. 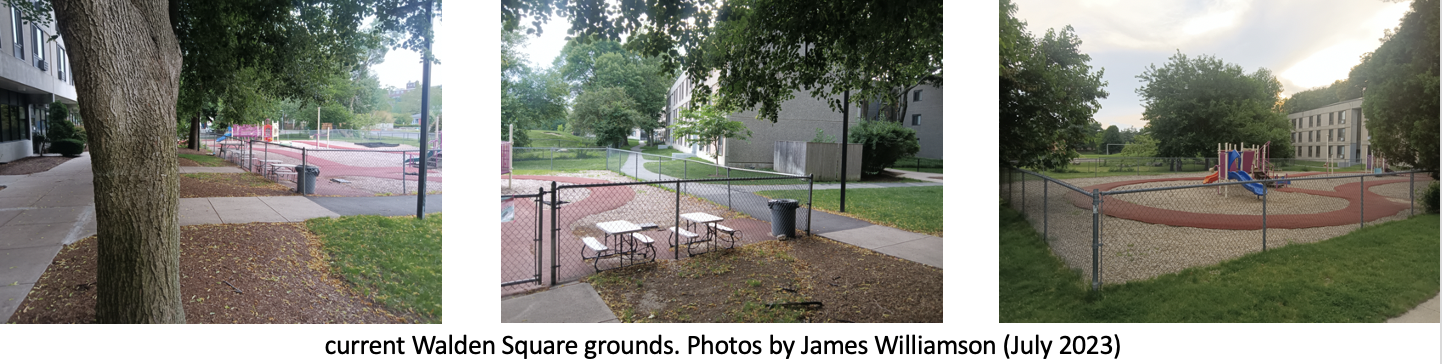 Currently neighbors from Raymond Street (and neighborhoods) can take a street through the complex to reach Danehy Park. With the new plans it would be more difficult to attain Danehy Park and because of the layout some have voiced concerns doing so. 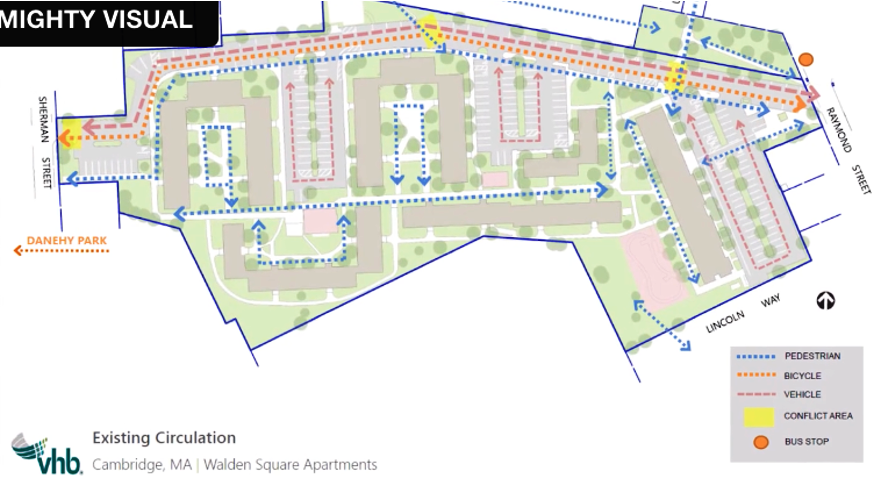 Residents of the tower at Walden Square responded to Winn’s earlier over-the-top plans. Opponents made a short video of that meeting which took place over Zoom. It is called The Public Speaks. The video looks at Winn’s plan from a design perspective and one can see serious problems with it. Several Councillors and Council Candidates supported Walden Square residents and neighbors in pushing for a better plan before the 2021 City Council election. Thank you Councillors Dennis Carlone and Patty Nolan as well as Nicola Williams. These same issues are in play in the current 2023 election cycle since the Walden Square plan 2.0 is back in play. Councillor Carlone worked with residents and neighbors to bring the plans more into scale, but with the pro-builder AHO 2.0 now in the works, Winn has decided not to follow through with key earlier concessions. This is not just about building design issues (though those are clearly important) but also the building management and the way Winn treats it tenants. On January 30, 2022 the City (the Mayor and Vice Mayor wrote to the City's Affordable Housing Trust about the problems with their property."Egregious and unresolved pest manifestation" "lack of appropriate communication from management to residents" "environment of intimidation." See letter below right. In a Cambridge Day article which included this letter a discussion of Trust members on this issue is also included: "Problems with management companies aren’t new – including complaints about Winn – and members of the Trust said Thursday that nothing the mayor and vice mayor said about Winn came as surprise. “It’s not news … that there have been some problems with Winn’s management of their existing housing. I’ve heard about it for years,” board member Susan Schlesinger said. Member Elaine DeRosa agreed “it’s been pretty constant,” and found that “even [Winn’s] response seems a little cheeky.” But the board also wasn’t sure what to do with the warning presented by Siddiqui and Mallon or the company’s response, save for keep them in mind when Winn returned with an application for the building it wants to put up called Walden Square II under the city’s new Affordable Housing Overlay zoning.There’s been a lot of community concern around this project,” Schlesinger said."
In addition to problems with the management of this Winn property that impacts residents living there, Residents also oppose the massive size increases of the Winn Project sought out an architect to create a model showing the impacts of these proposed changes (see below). What is left out of this model however is the significant loss of mature trees, parking and open space that these proposed changes also will bring. 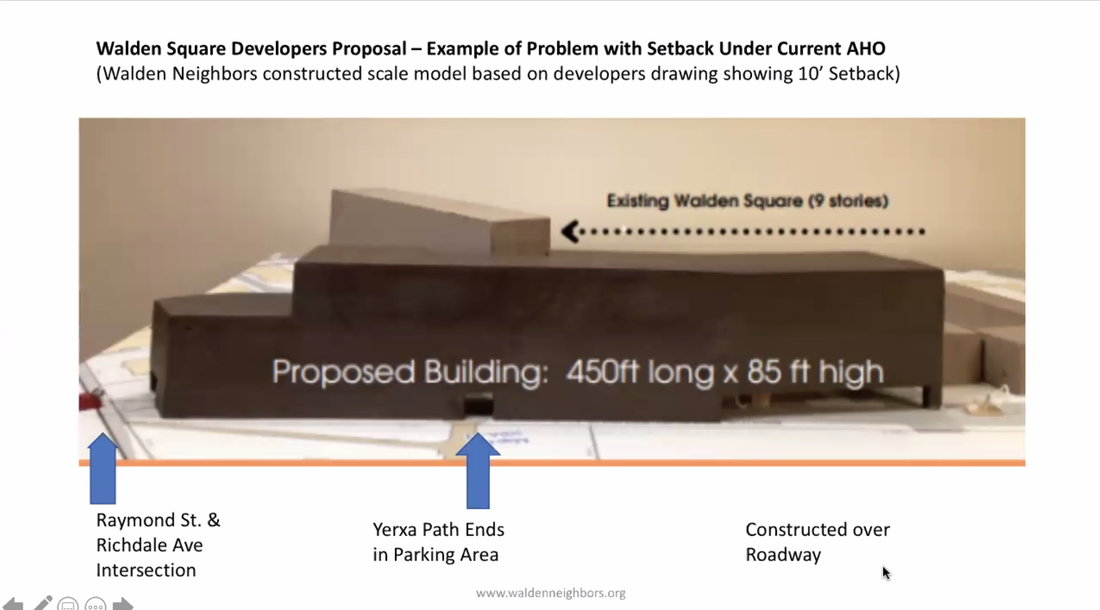 Since that time, the opponents have made another short video which offers an alternative approach to affordable public housing at Walden Sq, celebrating Lincoln Way as a success story; the city, the developers, and residents aligned on a vision: human-scaled public housing: townhouses, not towers. Winn’s insistence on building oversized buildings in an already densely populated section of the city has brought into play a response petition from all residents throughout the city concerned about rampant construction at any height and at any cost. See another informative video and sign the petition "Stop the Slabs at Walden Square" at the tab below. The Affordable Housing Project at Walden St. and 2072 Ma. Ave.
Capstone Properties (Sean Hope and Jason Korb - area for profit affordable housing developers) proposed an affordable housing project at 2072 Mass Ave (corner of Walden Street). The site is relative small, with heavy traffic and safety problems as cars make the tight turn onto Walden Street. The site also is adjacent to another affordable housing development - this one housing seniors who would feel especially heavily the impacts of the new tall structure. The seniors, the neighbors, and others opposed the project on various grounds. There were also concerns that only 1 elevator would serve the tenants of this 9 story building. And if that elevator is broken (as often happens, for considerable periods of time) disabled residents, seniors or those with young children, would have a difficult time. Imaging trekking up 10 bags of groceries 8 flights of stairs multiple trips! The BZA also opposed it due to the fact that they were asking for so many exceptions to the state requirements (the plans were not in compliance with Ma. state guidelines). Very heated meetings accompanied the discussion and in the end, Capstone withdrew the project, but the land (acquired for these for profit developers by the city of Cambridge still remains with them. While the plans for this property have yet to be determined, many members of the pro-builders political pac (now a super majority on City Council) have indicated that local opposition to 2072 Mass. Ave is one of the main reasons they put forward the AHO 2.0 that would allow 12 story affordable housing structures on every major city corridor and 15 story structures in each of the large squares. Like the AHO 1.0 both neighborhood and Planning Board input would only be advisory. Conclusions: We have an accountability problem with our affordable housing program. Our affordable housing developers are not required to follow ordained design regulations. Nor are many of these developers doing what the AHO was intended for them to do: compete with market rate housing and commercial developers for those properties in the city that come up. Instead many of the developers are rebuilding far larger and denser structures on the land they currently own. Another problem is that these developers are not seeking to create the best design possible (even with greater density). Good design does not cost more than bad design often. It just takes some creativity and will. As we go forward, we need far more design oversight and accountability than the current AHO 1.0 and AHO 2.0 mandate much less encourage.
Yes we want more housing affordability, especially for structures to house the c. 3,000-3,500 current city residents who are on our affordable housing list, built on city owned land and with city funds so that we are able to benefit specific groups of residents and workers (teachers, social workers, fire and police) who want to live here. However this needs to. be done according to our approved design guidelines and according to best practices in the affordable housing field. 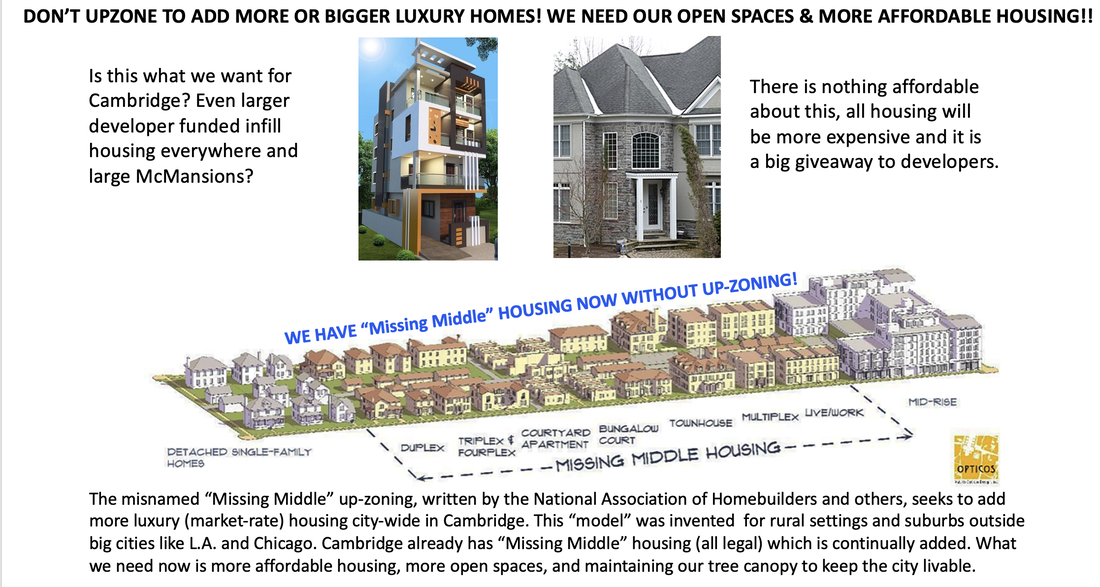 The New York private equity firm, Blackstone, has invested $12 billion in the larger Boston-area ($4.6 billion in Cambridge alone) n recent years, becoming by far the largest commercial landlord, according to a May 25, 2021 Boston Globe article. They and other investors are buying up prime real estate for labs that could have gone to housing, further driving up home prices, with ample-salaried employees, forcing out long time residents, and making it harder for people to afford houses here. The equity differentials are shocking. U.S. Census data shows that Cambridge has the 7th highest gap between the top 20% of earners who average $340,000 annually and the bottom 20% whose income averages $13,000 and the heaviest burdens by far are felt by Black Cantabridgians, where one third of Black home owners spent 30% of their income on housing and Black renters spent 55% of their income on housing. (Source: Cambridge Community Foundation Report as cited in the Boston Globe April 7.2021). How can anyone afford to live here any more? Few can! Indeed, the percentage of our Black residents has dropped exponentially through gentrification in recent years. Added to this problem, Cambridge, which comprises a tiny 7.2 square miles, and is one of the top 5 or 10 most dense urban areas nationally, is already bursting at the seams. We built extensively to try to keep up, far surpassing state affordable housing minimums, and by adding large numbers of inclusionary apartments. We have lost 18% of our tree canopy in the last decade, along with critical open spaces. Our homeless population is growing too. So why is the City doing nothing to stop or counter this? We need action and accountability now! Moreover, as one Cambridge City Councillor long affiliated with the ABC ("A Better Cambridge") Political Group which is pressing for city wide up-zoning to add more luxury housing wrote recently: "[Housing] is a regional issue....[W]e don't work well together (this is a housing, traffic, environmental and public transportation issue as well). The truth is, we could find housing for the 500 unhoused folks in our yearly census tomorrow and there will be 500 more on our streets in a week. Of course, this is not a reason not to try....but it will take more than Cambridge.... there is no easy answer. Building more housing is absolutely part of the solution, but housing alone won't do it and Cambridge can't build enough housing for every unhoused person in the Metro Boston area. It's going to take a regional effort" (Cambridgeport Neighborhood List serve: May 27, 2021). CCC agrees! And if, to this well known politician, "housing alone won't do it and we can't build enough," then why is he and others in this political group, promoting housing policies that will only make things worse for generations to come. Sadly, TWO NewThreats to Neighborhood Stability are in play that seek to add more LUXURY Housing, likely increasing costs far higher, adding to gentrification and the loss of long term residents. This is equally valid for the current push by some Councillors to add more luxury ("market rate") housing, even though this would likely remove still more rental units, increase housing costs, and add to land values and taxes. In addition this would lead to the loss of core open spaces (that in dense neighbors are shared visually by adjacent neighbors, along with critically needed trees, and the rich and diverse historic architectural fabric of the city. So why is the City doing nothing? Because we need elected officials accountable to the people who are willing to stand up to the outside developers and investors ! 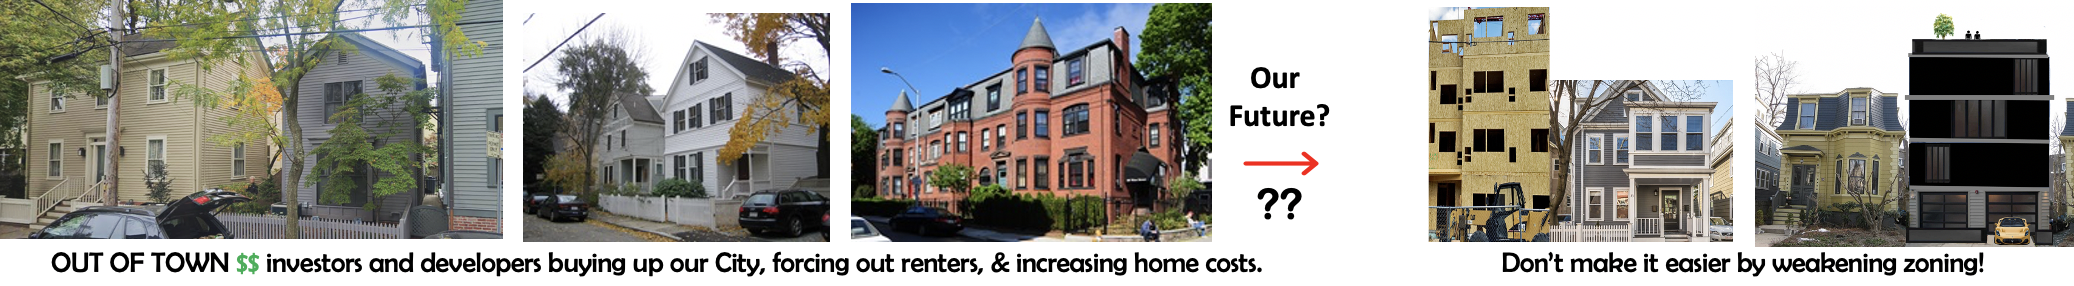 NEWS on the "Missing Middle Housing (MMH) Up-Zoning Petition: The citywide up-zoning petition (misnamed the "Missing Middle" -MMH) comes again before the Council's Ordinance Committee, this is after being VOTED DOWN by the Planning Board at their May 11, 2021 meeting based on a number of grounds: the lack of affordability, concerns about neighborhood impacts, design (scale), legal concerns and turning our housing concerns over to market forces. It will not be easy to persuade City Council to vote against this damaging city-wide luxury housing up-zoning because it too is being promoted by the pro-developer ABC Political PAC. What this petition does? The MMH Up-Zoning Petition calls for a massive zoning change to build more luxury (market rate) housing at far greater density than currently allowed. It promotes the demolition of current housing, diminishes open space and tree canopy, increases traffic, and encourages McMansions and multi-story luxury duplexes in every neighborhood. It jeopardizes affordable housing, adds ZERO housing for middle income residents, and benefits investors and developers. Who is behind this move? The MMH zoning petition has been promoted by the National Association of Home Builders (NAHB) and others; it will principally benefit non-resident investors and developers. Worse it will jeopardize affordable housing efforts, adding ZERO housing for middle income residents. It would allow dorm-size (40 foot tall, 1.25 FAR density) structures to be built in residential neighborhoods citywide, removing critical and fast declining neighborhood open spaces and our diminishing tree canopy. No affordable housing is included, nor is there any design review for these projects. Why this matters: Even the proponents admitted that it was aimed at providing more housing for people making more than $100,000 a year. Most likely the greatest impacts will be felt in now transitional neighborhoods such as the Port, North Cambridge and East Cambridge, areas that used to be among the most diverse in Massachusetts, but gentrification is changing the community. From Alewife to East Cambridge, Kendall MIT to North Point, the impact of real estate transformation will create irreversible consequences that decide who gets to call Cambridge home. What you can do: Please write City Council at: council@cambridgema.gov and CC the City Clerk at: cityclerk@cambridgema.govPlease write to City Councillors voicing your views about the MMH. You can reach all of them individually through this email: If you know any of them particularly well, also write to them separately. Sign Our Petition above or at: bit.ly/wakeupcambridge Read our opinion piece: "The 'Offal'" Truth About Cambridge Zoning,"which details how Cambridge's zoning changes are linked to the city's factory history and to the public health problems they caused: www.cambridgeday.com/2021/04/22/the-offal-truth-behind-cambridge-zoning/ Our city's zoning history has also been addressed by Charles Sullivan, Director of the Cambridge Historical Commission, at the Cambridgeport Neighborhood Association. This video titled "Neighborhood Zoning & Development History" can be viewed at www.cambridgeport.org/history. Regardless of the origin of today's wealth disparities in Cambridge, the Planning Board seemed generally persuaded that the MMH as presented would only make things worse. LEARN MORE: at our "Missing Middle" tab above! READ our letter on the MMH published in Cambridge Day titled "'Missing Middle' zoning is bait and switch, Cambridge Style, and won't add affordability" 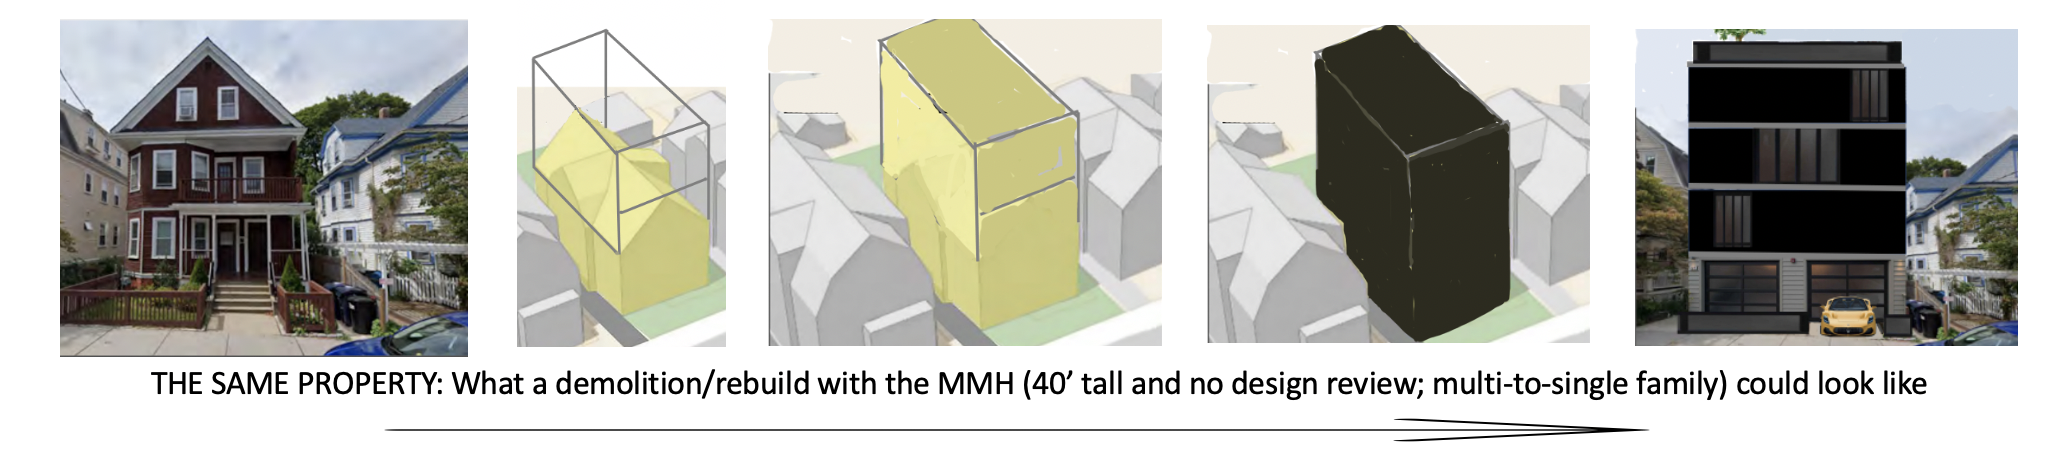 May 2021 Amendments to the MMH are found at https://drive.google.com/file/d/1xLxm-XB2DlOazES8Zavzbwrz5rCT_waO/view The proposed Cambridge "Missing Middle Housing" (MMH) citywide up-zoning petition promoted by the National Association of Home builders (NAHB) and their allies will NOT create affordable housing but rather will displace tenants as their buildings are sold to make way for luxury developments. It would also increase density throughout the city, further diminishing of our threatened tree canopy and limited green space. Under the false promise of providing more affordable housing, this proposal puts a bullseye on single-family and two or three deckers throughout Cambridge. How? By slashing set-backs on all sides and allowing 40 foot tall building on every property. The result: Dorm-level density allowed on even the smallest streets. Each lot could be maxed out, including replacing an existing home entirely - all with NO design review or concern for even direct abutters. New owners could also decide to build themselves a McMansion, adding stories and additions that can tower over their neighbors. If new units are created, NO off-street parking would be required - no matter how many new cars might reasonably be expected. This is NOT affordable housing: Only developments of 10 or more units are required to provide any affordable housing. Land and construction costs in Cambridge are among the very highest in the US; most new units would have to be luxury, not even middle-income, to make the return on investment work. As the 10% most densely populated city in the country, and one with hundreds of new units already added every year under existing rules, Cambridge needs smart growth, not a modern-day land rush that displaces current tenants. Want to volunteer? email us at info@CCCoalition1@gmail.com _____________________________________________________________________________ What will the MMH Up-Zoning Petition Change in Cambridge Citywide Residential Zoning? -Increases to allow dorm-size residential density (FAR) everywhere: 1.25. -Increase to residential height allowances everywhere: 40' (4 story equivalent). -Decrease to lot size per dwelling unit, allowing: 500sqft / unit -Decrease to front yard setbacks: 10' (unless neighboring lots are smaller) -Decrease to side yard setbacks: 7'6" (or 5' if the neighboring lot is significantly set back) -Decrease to rear yard setbacks: 10' -Remove cornice line requirement on town houses, encouraging box-like flat-roofed buildings. What will the MMH Up-Zoning also do? -Allow for home demolitions, evictions, and displacements to add more, larger luxury housing. -Promote the conversion of rental properties into expensive condos -Encourage more gentrification in transitional neighborhoods -Promote the removal of existing green spaces and our declining tree canopy. What will the MMH Up-Zoning Petition NOT do? -Provide more affordable housing. -Provide design review for new home additions or new housing on existing property. -Allow immediate neighbors to address design impacts. -Further any of the core Envision goals. Misinformation being Promoted by MMH supporters -That current homes created in lower or higher zoning spec eras are somehow now "illegal." Not True. -That demolishing a still viable home, filling up local dumpsite, cutting more trees to build bigger is good environmentally. Not true. -That trickle-down supply-down theories re.housing work any better than for taxable income changes. Not true. - That adding more market-rate (luxury) housing will decrease housing and rental costs. Not true (just the opposite). _____________________________________________________________________________ What are people saying about the city-wide up-zoning "Missing Middle" proposal? "Asking for-profit developers to fix the affordable housing problem is like asking an arsonist to put out their own fire. What is their incentive?" in "Black Response Cambridge Up-zoning Petition: 'Missing Middle' Fails for Housing Affordability" in Cambridge Day, Feb. 15, 2021. -Stephanie Guirand, Resident of the Port, Graduate Student and Author "The 'Missing Middle' is a blanket policy that leaves out and misses the presence of already diverse residential portfolios that the city offers and that should be enhanced and not opened up to speculative and short-sighted speed of building over quality housing. Community design review is essential to the success of any development regardless of size, by addressing the context in which it will exist and the lives it will host." -Fabrizio Gentili, East Cambridge Resident and Realtor There is no middle class in the city of Cambridge and there is no middle-income housing in the city of Cambridge. You are either rich or you are poor in the city of Cambridge and the City has to do a better job providing middle income housing for us." -Greg O'Bannon. Resident of the Port. Transportation Worker "The desired scale and density of the so-called Missing Middle has long been in place in Cambridge. Advocates for the 'Missing Middle' (including developers) many from out of town, decry the fact that many homes were built before current zoning laws, and do not meet these minimums, wanting to rebuild the entire city according to new far taller and denser zoning (now in place for dorms) and fill in open spaces between homes, removing trees and green spaces." -Fritz Donovan, Esq. Mid-Cambridge Resident. Immigration Attorney "The 'Missing Middle' Proposal is nothing more than a developer's money-making scheme that will result in excessive over building and will strain our already stressed infrastructure. Despite its catchy slogan. It is an over development Frankenstein, advanced without regard to real housing demands and other city needs. -Katiti Kironde, North Cambridge, Designer "We are the middle. There are many multi-family free standing homes that pepper the neighborhood. 'Missing Middle' will displace current residents like us so investors and private contractors can tear down our homes, eradicate our small green space and make money rebuilding at great cost that they pass on to our replacements as we join the missing. That's a construction jobs program and private developers' boondoggle, not a solution to a housing crisis." - Phil Wellons. Riverside Resident. Consultant MMH AND THE CAMBRIDGE HOUSING QUESTIONS
Housing costs are now prohibitive. More and more multi-family homes (often with long-time renters) are gobbled up outside developers, gut rehabbed and sold to the highest bidder, driving up neighborhood property values, along with taxes, rents and more. The whole city is being hit, and more and more of our longtime residents - including many African Americans - are being forced out. ISSUES 2022: Housing Costs, Environment, and Smart Planning Citywide Up-Zoning Discussions are underway with a focus on our residential areas to add more Market Rate (Luxury) housing through infill housing or tearing down and replacing current homes. Thanks everyone who has been engaged on this issue. More to Come! On Jan. 26, 2022 Another Planning Board meeting on up-zoning Cambridge residential areas. While at the outset Board Members voiced concern for the impacts of such a large up-zoning on housing affordability, the environment, and more, by the end of the meeting, with the nudging of the Cambridge Community Development Department (CDD) the ground seemed to shift. One member was OK with allowing 4-6 story buildings for more market rate (luxury) housing as of right everywhere; another was OK with cutting down mature trees if one paid into a fund to plant back small trees some where; another was OK with the density level of District C residential properties (very compressed) city wide - pushing aside current set backs, open space requirements, and other factors. This process is still in play. On Jan. 5, Cambridge Day editor, Marc Levy, has published an article on this Planning Board Meeting: HERE Tuesday January 18, 2022, the Planning Board took up ending our current single-family and two-family zoning restrictions to allow more market rate housing citywide. The CDD (Cambridge Development Department) overview is HERE. Simply up-zoning in this way to add more market rate (luxury housing) will
We had success at the last Planning Board meeting on Jan. 4! The Planning Board to the person voiced sizable concerns to CDD's Option 1 and up-zoning the residential areas more generally. They concluded that this plan must be sent back to the CDD to come up with other suggested plans. The Donovan petition proposal (the Advancing Housing Affordability plan) was viewed favorably as a good starting point by several Board members. A huge thanks to all the CCC members and friends who wrote in and spoke at this meeting. You made a big difference! The fight is not over, but this is a great way to begin this effort! Our Op Ed "Whatever Zoning" appeared in Cambridge Day We also created this as a blogpost by this name and have been including updates at the bottom of the post. You can read and comment HERE Earlier we addressed some of the issues in our blog post on the problems about adding more market rate housing: Where to Start? Early January 2022 pro-Developer Citywide Residential Up-zoning in Play |